1,894
Views
17
CrossRef citations to date
0
Altmetric
Research Paper

In vitro and in silico interaction of porcine α-amylase with Vicia faba crude seed extract and evaluation of antidiabetic activity

&
Pages 393-403 | Received 05 Aug 2016, Accepted 07 Sep 2016, Published online: 28 Oct 2016

Figures & data

Figure 1. Showing minimized energy structure. (A) Porcine α- amylase; (B) Acarbose; (C) Gallic acid; (D) Catechin; (E) Epicatechin; (F) Proanthocyanidin.
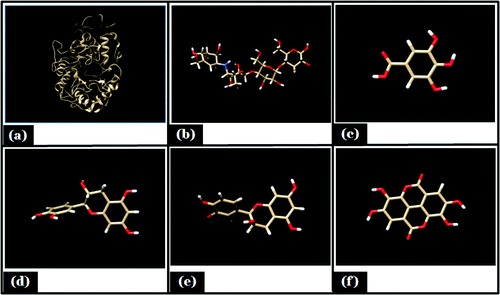
Figure 1. Showing minimized energy structure. (A) Porcine α- amylase; (B) Acarbose; (C) Gallic acid; (D) Catechin; (E) Epicatechin; (F) Proanthocyanidin.

Table 1. Chemoprofiling of Vicia faba seed extracts in different solvents.

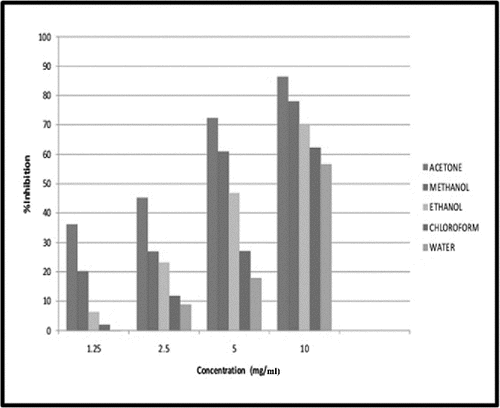
Figure 2. Inhibitory potency of Vicia faba seed extracts against α-amylase activity.

Figure 2. Inhibitory potency of Vicia faba seed extracts against α-amylase activity.

Table 2. IC50 values for α-amylase inhibitory potential of Vicia faba seed extracts.

Figure 3. Mode of inhibition of α-amylase by acetone and methanol seed extract (Michaelis- Menten plot).
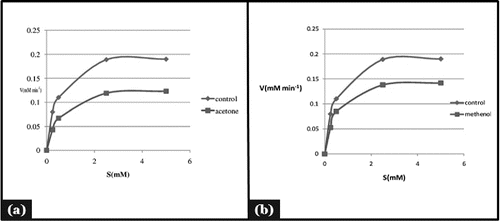
Figure 3. Mode of inhibition of α-amylase by acetone and methanol seed extract (Michaelis- Menten plot).

Figure 4. Mode of inhibition of α-amylase by acetone and methanol seed extract (Lineweaver-Burk plot).
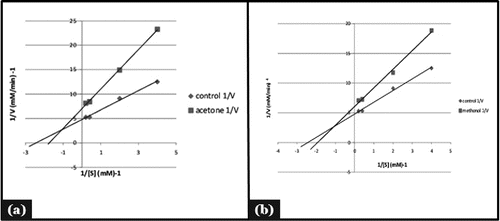
Figure 4. Mode of inhibition of α-amylase by acetone and methanol seed extract (Lineweaver-Burk plot).

Table 3. Kinetic analysis of Vicia faba seed extract with respect to reference molecule.

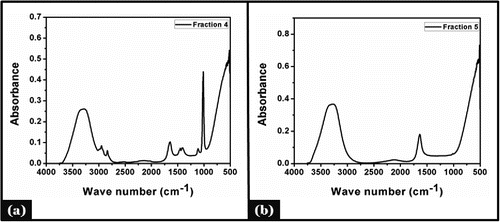
Figure 5. FTIR analysis of (A) fraction 4 (B) fraction 5 showing different functional groups.

Figure 5. FTIR analysis of (A) fraction 4 (B) fraction 5 showing different functional groups.

Table 4. Total sugar.total phenol content of acetonic seed extract fraction.

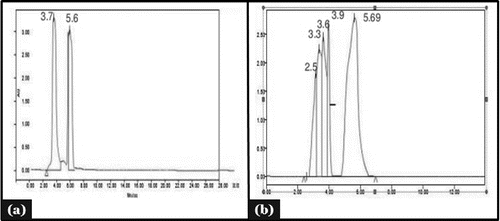
Figure 6. HPLC analysis of (A) tannic acid and (B) acetonic seed fraction 5.

Figure 6. HPLC analysis of (A) tannic acid and (B) acetonic seed fraction 5.

Figure 7. Lig plot showing hydrogen bonding and hdrophobic interaction in different ligand, (A) Acarbose; (B) Epicatechein; (C) Gallic acid; (D) Proanthocyanidin; (E) Catechin with porcine α- amylase.
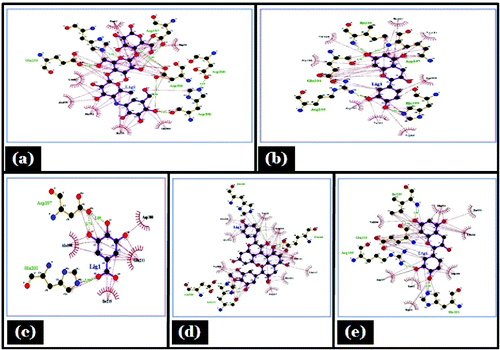
Figure 7. Lig plot showing hydrogen bonding and hdrophobic interaction in different ligand, (A) Acarbose; (B) Epicatechein; (C) Gallic acid; (D) Proanthocyanidin; (E) Catechin with porcine α- amylase.

Figure 8. Showing autodock tool analysis of different types of interaction in different ligands. (A) Catechin; (B) Epicatechin; (C) Acarbose; (D) Proanthocyanidin; (E) Gallic acid with porcine α- amylase.
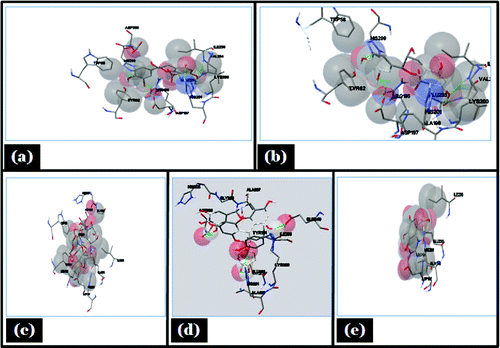
Figure 8. Showing autodock tool analysis of different types of interaction in different ligands. (A) Catechin; (B) Epicatechin; (C) Acarbose; (D) Proanthocyanidin; (E) Gallic acid with porcine α- amylase.

Table 5. Docking analysis of different ligands with porcine α amylase.

Reprints and Corporate Permissions

Please note: Selecting permissions does not provide access to the full text of the article, please see our help page How do I view content?

To request a reprint or corporate permissions for this article, please click on the relevant link below:

Academic Permissions

Please note: Selecting permissions does not provide access to the full text of the article, please see our help page How do I view content?

Obtain permissions instantly via Rightslink by clicking on the button below:

If you are unable to obtain permissions via Rightslink, please complete and submit this Permissions form. For more information, please visit our Permissions help page.