890
Views
5
CrossRef citations to date
0
Altmetric
Research Paper

Production of encapsulated creatinase using yeast spores

, , , &
Pages 411-419 | Received 24 Jun 2016, Accepted 22 Sep 2016, Published online: 28 Oct 2016

Figures & data

Figure 1. Activity assay of creatinase expressed in yeast spores. (A) 50 µg of lysates from intact asci (ascus), spores (spore) and vegetative cells (vege) expressing creatinase–HA were subjected to western blot analysis using an anti–HA antibody to detect the HA fusion (arrow). Spores harboring an empty vector, pRS426TEF, were used as a control. The spore sample was prepared by treating asci with β-glucanase and sonication to lyse the ascal cell wall and membrane. Vegetative cells were cultured in YPAcetate media. (B) Creatinase–HA expressed in wild-type spores was treated with or without PNGase F, and subjected to western blot analysis using an anti–HA antibody. (C) Creatinase activity was detected from intact asci (ascus), spores (spore) or vegetative cells (vege) expressing creatinase–HA, and spores harboring the empty vector (vector). The activity detected in the reaction mixture without yeast cells is also shown (blank). 5×10⁸ of cells or asci were used for the assay. Cell amounts were adjusted by turbidity and, for the spore sample, it was measured before asci were broken. One unit of activity was defined as the amount (mg) of enzyme which produces 1 µmol of urea per minute at 37°C. Data presented are the mean ± SE of 3 independent samples. **P< 0.01; ***P< 0.001.
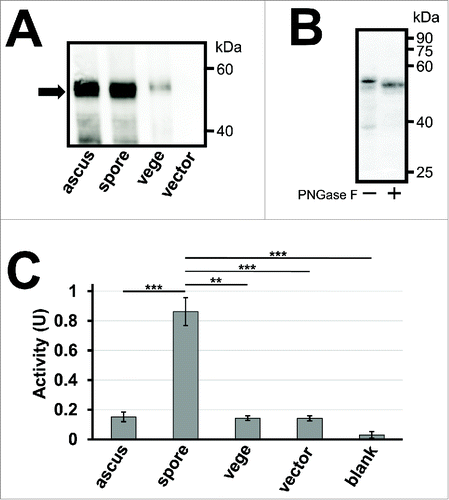
Figure 1. Activity assay of creatinase expressed in yeast spores. (A) 50 µg of lysates from intact asci (ascus), spores (spore) and vegetative cells (vege) expressing creatinase–HA were subjected to western blot analysis using an anti–HA antibody to detect the HA fusion (arrow). Spores harboring an empty vector, pRS426TEF, were used as a control. The spore sample was prepared by treating asci with β-glucanase and sonication to lyse the ascal cell wall and membrane. Vegetative cells were cultured in YPAcetate media. (B) Creatinase–HA expressed in wild-type spores was treated with or without PNGase F, and subjected to western blot analysis using an anti–HA antibody. (C) Creatinase activity was detected from intact asci (ascus), spores (spore) or vegetative cells (vege) expressing creatinase–HA, and spores harboring the empty vector (vector). The activity detected in the reaction mixture without yeast cells is also shown (blank). 5×10⁸ of cells or asci were used for the assay. Cell amounts were adjusted by turbidity and, for the spore sample, it was measured before asci were broken. One unit of activity was defined as the amount (mg) of enzyme which produces 1 µmol of urea per minute at 37°C. Data presented are the mean ± SE of 3 independent samples. **P< 0.01; ***P< 0.001.

Figure 2. Activities of creatinase expressed in spore wall deficient mutants, osw2Δ, dit1Δ, and chs3Δ. (A) 50 µg of lysates from wild-type (wt), osw2Δ, dit1Δ, or chs3Δ spores expressing creatinase–HA were subjected to western blot analysis using an anti–HA antibody to detect the HA fusion (arrow). Wild-type spores harboring the empty vector was used as a control. (B, C) Creatinase activity was measured for 28 mg of indicated wet spores (B) or 5 mg of freeze-dried spores (C) expressing creatinase–HA. Spore samples were purified by percoll gradient centrifugation before measuring weight or freeze-drying. Wild-type spores harboring the empty vector were used as a control. Data presented are the mean ± SE of 3 independent samples. *P < 0.05; **P < 0.01; ***P < 0.001; NS, not significant.
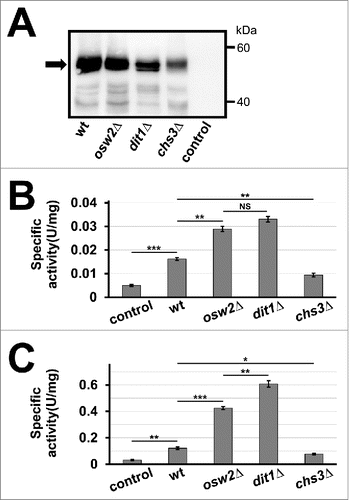
Figure 2. Activities of creatinase expressed in spore wall deficient mutants, osw2Δ, dit1Δ, and chs3Δ. (A) 50 µg of lysates from wild-type (wt), osw2Δ, dit1Δ, or chs3Δ spores expressing creatinase–HA were subjected to western blot analysis using an anti–HA antibody to detect the HA fusion (arrow). Wild-type spores harboring the empty vector was used as a control. (B, C) Creatinase activity was measured for 28 mg of indicated wet spores (B) or 5 mg of freeze-dried spores (C) expressing creatinase–HA. Spore samples were purified by percoll gradient centrifugation before measuring weight or freeze-drying. Wild-type spores harboring the empty vector were used as a control. Data presented are the mean ± SE of 3 independent samples. *P < 0.05; **P < 0.01; ***P < 0.001; NS, not significant.

Figure 3. Repetitive use of creatinase encapsulated in spores. (A) For 5 mg of purified wild-type (wt), osw2Δ, and dit1Δ spores expressing creatinase–HA, first creatinase activity was assayed (first assay). After washing with 0.6 M NaCl solution containing 0.5% Triton X-100, the activities were assayed again (second assay). This cycle was repeated 4 times. For each sample, the activity obtained at the first assay was determined as 1.0 and relative activities are shown. Data presented are the mean ± SE of 3 independent samples. (B) Specific activities of the above spores before wash and after 4-time wash are shown. Data presented are the mean ± SE of 3 independent samples. **P < 0.01; ***P < 0.001.
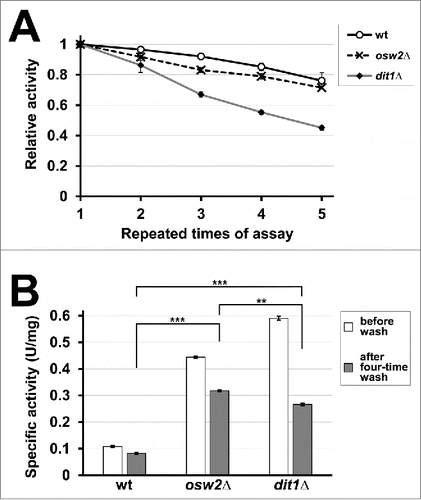
Figure 3. Repetitive use of creatinase encapsulated in spores. (A) For 5 mg of purified wild-type (wt), osw2Δ, and dit1Δ spores expressing creatinase–HA, first creatinase activity was assayed (first assay). After washing with 0.6 M NaCl solution containing 0.5% Triton X-100, the activities were assayed again (second assay). This cycle was repeated 4 times. For each sample, the activity obtained at the first assay was determined as 1.0 and relative activities are shown. Data presented are the mean ± SE of 3 independent samples. (B) Specific activities of the above spores before wash and after 4-time wash are shown. Data presented are the mean ± SE of 3 independent samples. **P < 0.01; ***P < 0.001.

Table 1. Km values of creatinase–HA in wild-type, osw2Δ, dit1Δ, or chs3Δ spores, and the free creatinase–HA at 50°C are shown.

Figure 4. Assessment of the activities of the encapsulated creatinases at various temperatures (A) and pH (B). To assess temperature and pH sensitivities for indicated spores harboring creatinase–HA or free creatinase–HA, their activities were assayed at various temperatures (30°C to 90°C) and pH (5 to 12). As the free enzyme, creatinase–HA secreted from vegetative yeast cells was used. The maximum activity obtained for each assay was determined as 1.0 and relative activities are shown. For the pH sensitivity, potassium phosphate buffer (pH 5 to 10) and sodium carbonate buffer (pH 10 to 12) were used. Data presented are the mean ± SE of 3 independent samples. Statistic analysis was performed between free creatinase and osw2Δ spores, and asterisks were deposited when statistically significant differences were found. *P < 0.05; **P < 0.01; ***P < 0.001.
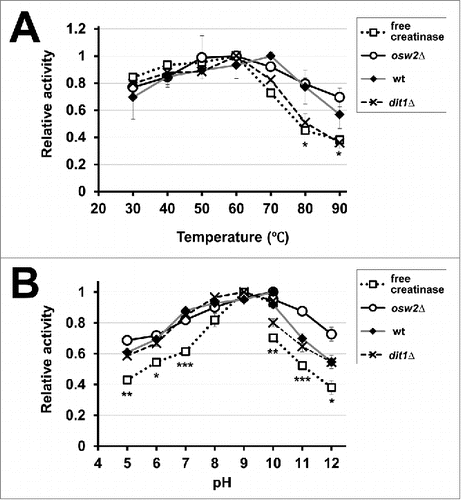
Figure 4. Assessment of the activities of the encapsulated creatinases at various temperatures (A) and pH (B). To assess temperature and pH sensitivities for indicated spores harboring creatinase–HA or free creatinase–HA, their activities were assayed at various temperatures (30°C to 90°C) and pH (5 to 12). As the free enzyme, creatinase–HA secreted from vegetative yeast cells was used. The maximum activity obtained for each assay was determined as 1.0 and relative activities are shown. For the pH sensitivity, potassium phosphate buffer (pH 5 to 10) and sodium carbonate buffer (pH 10 to 12) were used. Data presented are the mean ± SE of 3 independent samples. Statistic analysis was performed between free creatinase and osw2Δ spores, and asterisks were deposited when statistically significant differences were found. *P < 0.05; **P < 0.01; ***P < 0.001.

Figure 5. Assessment of sensitivities of the encapsulated creatinase toward environmental stresses. 4 mg of indicated purified freeze-dried spores containing creatinase–HA were treated with proteinase K for 12 h (A) or 5% SDS for 10 min (B) at 30°C, and then creatinase activities were assayed. For each sample, the activities obtained before the treatments were determined as 1.0 and relative activities are shown. Culture media containing the soluble creatinse–HA was used as a control (free). Specific activities before the treatments were indicated under the sample names. Data presented are the mean ± SE of 3 independent samples. Results of the t-test among osw2Δ, dit1Δ spores and the free enzyme were shown. *P < 0.05; ***P < 0.001; NS, not significant.
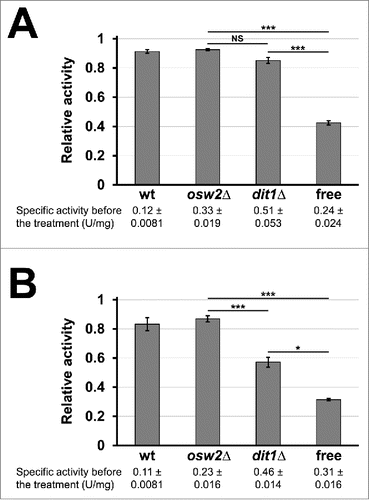
Figure 5. Assessment of sensitivities of the encapsulated creatinase toward environmental stresses. 4 mg of indicated purified freeze-dried spores containing creatinase–HA were treated with proteinase K for 12 h (A) or 5% SDS for 10 min (B) at 30°C, and then creatinase activities were assayed. For each sample, the activities obtained before the treatments were determined as 1.0 and relative activities are shown. Culture media containing the soluble creatinse–HA was used as a control (free). Specific activities before the treatments were indicated under the sample names. Data presented are the mean ± SE of 3 independent samples. Results of the t-test among osw2Δ, dit1Δ spores and the free enzyme were shown. *P < 0.05; ***P < 0.001; NS, not significant.

Table 2. Yeast strains used in this study.

Table 3. Oligo nucleotide primers used in this study.

Reprints and Corporate Permissions

Please note: Selecting permissions does not provide access to the full text of the article, please see our help page How do I view content?

To request a reprint or corporate permissions for this article, please click on the relevant link below:

Academic Permissions

Please note: Selecting permissions does not provide access to the full text of the article, please see our help page How do I view content?

Obtain permissions instantly via Rightslink by clicking on the button below:

If you are unable to obtain permissions via Rightslink, please complete and submit this Permissions form. For more information, please visit our Permissions help page.