Figures & data
Figure 1. (a) Protein concentration in the control and experimental groups (by month).(b) Indirect ELISA of the M2e-specific IgY antibody.
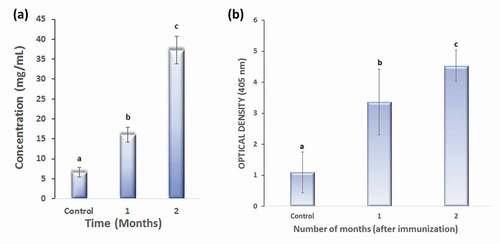
Figure 2. Schematic illustration of the antibody-enzyme conjugation method.
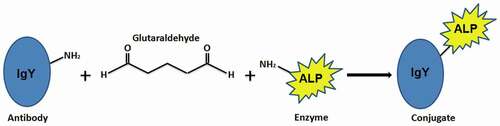
Figure 3. (a) Fluorescence spectrum of the M2e-specific IgY antibody. (b) Fluorescence spectrum of the ALP enzyme. (c) Fluorescence spectrum of the M2e-specific IgY-ALP bioconjugate. (d) A comparison of the fluorescence spectra following conjugation reaction.
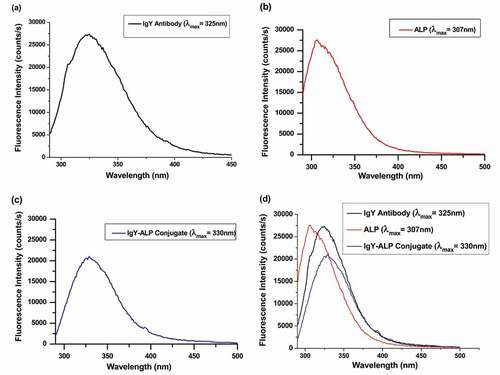
Figure 4. FTIR spectrum of the M2e-specific IgY antibody.
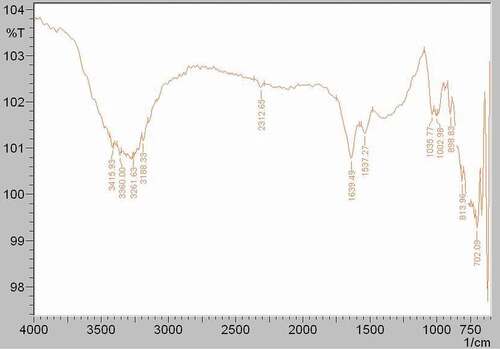
Figure 5. FTIR spectrum of the ALP enzyme.
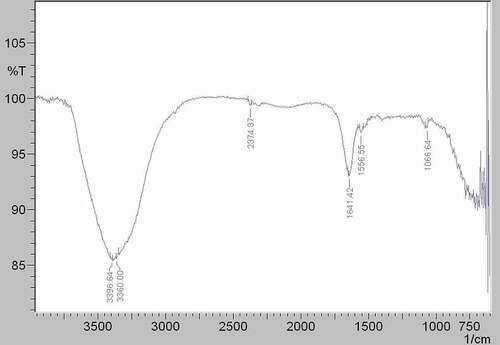
Figure 6. FTIR spectrum of the M2e-specific IgY-ALP bioconjugate.
Figure 7. Sandwich ELISA of M2e peptide antigens in nasopharyngeal specimens. (I: H3N2; II: H1N1), Error bars indicate the standart deviation. Mean value of negative control is 0.2184, and cut-off value is 0.257.
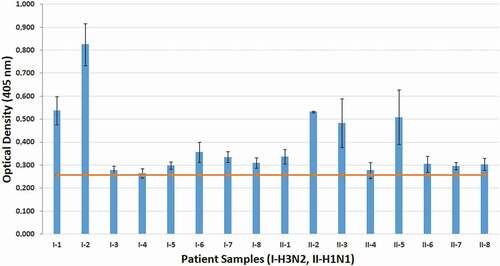
Table 1. Primer-probe sequences.
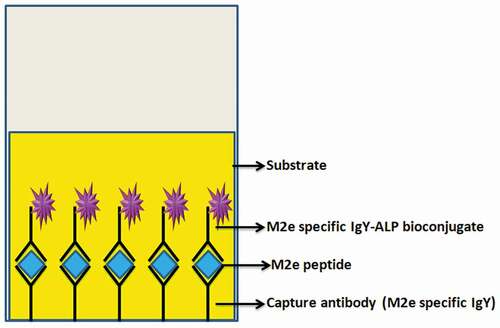
Figure 8. Schematic illustration of the sandwich ELISA method.