Figures & data
Table 1. Factors and their levels in the uniform design.
Figure 1. The phylogenetic tree of the genus Bacillus showing the position of the novel deep-sea strain FA13.
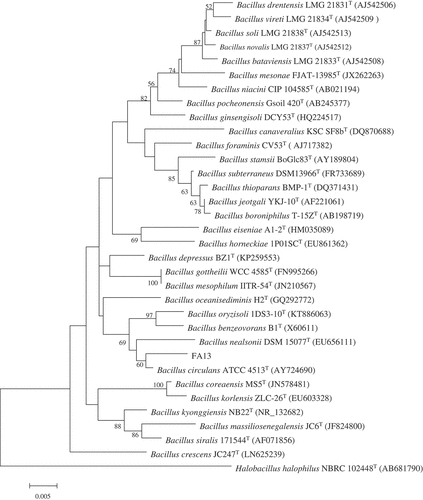
Table 2. Anti-fungal and anti-aflatoxigenic activities of the 10 times diluted supernatants obtained from different experiment runs designed by uniform design.
Table 3. Results of the multifactor and reciprocal regression analysis with the highest mycelia growth inhibition ratio.
Table 4. Results of multifactor and square regression analysis with the highest aflatoxin inhibition ratio.
Table 5. Comparison of predicted values and measured values of different optimized fermentation protocols.
Table 6. Inhibition ratios of mycelia growth and aflatoxin of the 20 times diluted supernatants obtained from three batches of the protocol 1.
Figure 2. tip culture assays of the 20 times diluted supernatants obtained from three batches of the optimized protocol 1.
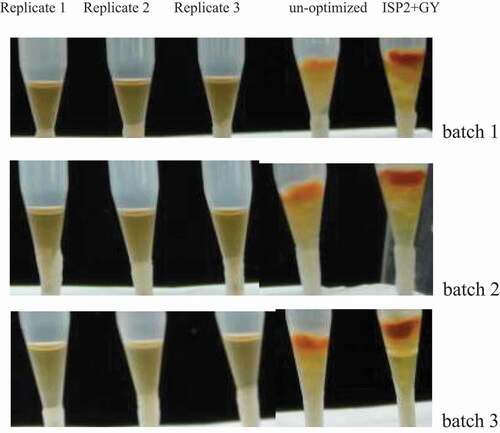
Table 7. Comparison of various factors between the optimized protocol and the original protocol.
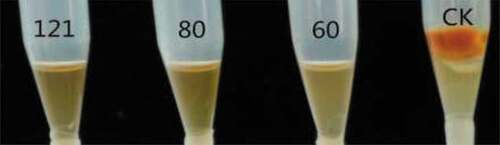
Figure 3. Effect of different heat treatment of fermented cell-free supernatants on the inhibition of mycelia growth and red pigment production (CK stands for GY medium).