Figures & data
Figure 1. MiR-485–5p expression in SCLC tissues. (a). Comparison of the expression levels of miR-485-5p between SCLC tissues and the adjacent normal tissues. The expression levels of miR-485-5p in the SCLC tissues and the corresponding adjacent normal tissues from SCLC patients were detected by RT-qPCR using β-actin mRNA as an internal standard (n = 18). (b). Comparison of the expression levels of miR-485-5p between SCLC tissues from patients (n = 18) and normal tissues from healthy people (n = 56). miR-485-5p levels were detected by RT-qPCR using U6 RNA as an internal standard (p<0.01). Values were expressed as mean ± SD.
Figure 2. The levels of MiR-485-5 level in NCI-H446 and NCI-H1688 cells transfected with miR-485-5p mimics, miR-485-5p inhibitor or their corresponding controls. The expression levels of miR-485-5p were normalized to U6 RNA expression and were presented as the mean ± SEM from three independent experiments. (a), NCI-H446 cells were transfected with miR-485-5p mimic or mimimics-NC; (b), NCI-H446 cells were transfected with miR-485-5p inhibitor or the corresponding control; (c), NCI-H1688 cells were transfected with miR-485-5p mimics or mimics-NC; (d), NCI-H1688 cells were transfected with miR-485-5p inhibitor or the corresponding inhibitor control (n=3, **p<0.01).
Figure 3. Effects of miR-485-5p and its inhibitor on the cell proliferation ability in NCI-H446 and NCI-H1688 cells. Cell viability was determined by MTS assay(a,b) and trypan blue exclusion assay(c,d) and expressed as mean ± SEM from three independent experiments. (a), NCI-H446 cells were transfected with miR-485-5p mimics or mimics-NC and miR-485-5p inhibitor or inhibitor-NC; (b), NCI-H1688 cells were transfected with miR-485-5p mimics or mimics-NC and miR-485-5p inhibitor or inhibitor-NC; (n = 3, *p < 0.05). (c), NCI-H446 cells were transfected with miR-485-5p mimics or mimics-NC and miR-485-5p inhibitor or inhibitor-NC; (d), NCI-H1688 cells were transfected with miR-485-5p mimics or mimics-NC and miR-485-5p inhibitor or inhibitor-NC; (n=3, *p<0.05).
Figure 4. Effects of miR-485-5p and its inhibitor on the cell migration ability in NCI-H446 and NCI-H1688 cells. Cell migration was determined by Boyden chamber assay. The number of cells migrated across the membrane were quantified and expressed as mean ± SEM from three independent experiments. (a), Boyden chamber assay of NCI-H446 cells; NCI-H446 cells were transfected with miR-485-5p mimics, miR-485-5p inhibitor or their corresponding controls (mimics-NC, inhibitor-NC), respectively; (b), comparison of the number of migrated cells among the NCI-H446 cells transfected with miR-485-5p mimics, miR-485-5p inhibitor or their corresponding controls; (c), NCI-H1688 cells were transfected with miR-485-5p mimics, miR-485-5p inhibitor or their corresponding controls (mimics-NC, inhibitor-NC), respectively; (d), comparison of the number of migrated cells among the NCI-H1688 cells transfected with miR-485-5p mimics, miR-485-5p inhibitor or their corresponding controls (n=3, *p<0.05, **p<0.01).
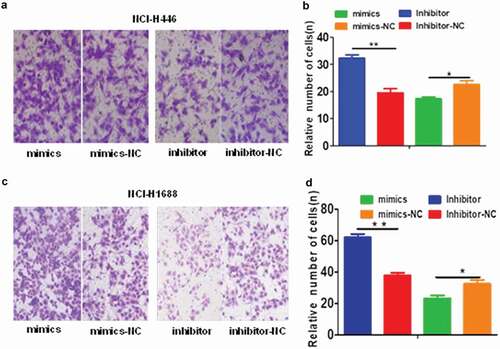
Figure 5. Effects of miR-485-5p and its inhibitor on the cell invasion ability in NCI-H446 and NCI-H1688 cells. Cell invasion ability of NCI-H446 and NCI-H1688 cells was determined by Transwell matrigel invasion assay. The number of cells invaded into the matrigel were quantified and expressed as mean ± SEM from three independent experiments. (a), Transwell matrigel invasion assay of NCI-H446 cells; NCI-H446 cells were transfected with miR-485-5p mimics, miR-485-5p inhibitor or their corresponding controls (mimics-NC, inhibitor-NC), respectively; (b), comparison of the number of invaded cells among the NCI-H446 cells transfected with miR-485-5p mimics, miR-485-5p inhibitor or their corresponding controls; (c), Transwell matrigel invasion assay of NCI-H1688 cells; NCI-H1688 cells were transfected with miR-485-5p mimics, miR-485-5p inhibitor or their corresponding controls (mimics-NC, inhibitor-NC), respectively; (d), comparison of the number of invaded cells among the NCI-H1688 cells transfected with miR-485-5p mimics, miR-485-5p inhibitor or their corresponding controls (n=3, *p<0.05, **p<0.01).
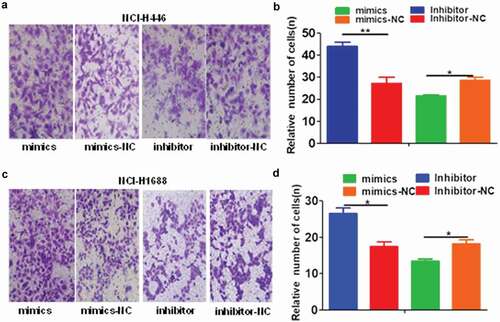
Figure 6. MiR-485-5p targets 3′-UTR of FLOT2 mRNA to inhibit its translation. (a), bioinformatics analysis revealed a miR-485-5p-binding site in the 3ʹUTR of FLOT2 mRNA. (b), Western blotting of FLOT2 protein in NCI-H446 cells transfected with miR-485-5p mimics, miR-485-5p inhibitor or their corresponding controls (miR-NC, inhibitor-NC), respectively; (c), comparison of FLOT2 protein levels among NCI-H1688 cells transfected with miR-485-5p mimics, miR-485-5p inhibitor or their corresponding controls; (d), bioinformatics analysis revealed a miR-485-5p-binding site in the 3ʹUTR of FLOT1 mRNA and Western blotting of FLOT1 protein in NCI-H446 cells and NCI-H1688 transfected with miR-485-5p mimics and miR-NC. FLOT2 protein levels were determined by Western blot assay and normalized to GAPDH. The data represent the mean ± SEM from three independent experiments (n = 3, *p < 0.05).
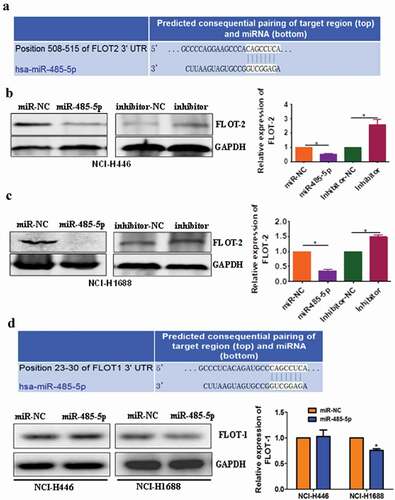
Figure 7. FLOT2 was directly targeted by miR-485-5p. (a), sequence of the miR-485-5p-binding site in the 3ʹUTR of FLOT2 mRNA and the sequence of the mutation introduced into the site; (b), effects of miR-485-5p on the translation of the reporter gene inserted downstream of the 3ʹUTR of FLOT2 mRNA or the mutated 3ʹUTR of FLOT2 mRNA in NCI-H446 cells. NCI-H446 cells were co-transfected with the indicated constructs and miR-485-5p, and luciferase activities were measured using the Dual Luciferase Reporter Kit. The luciferase activity was normalized and expressed as the ratio of firefly/Renilla luciferase activities. Data represent the mean ± SEM of triplicate experiments (n = 3, p < 0.05).
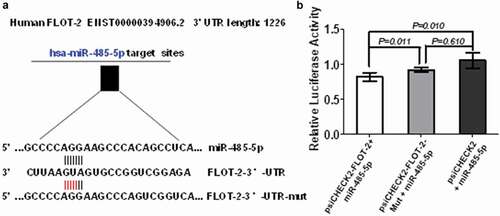
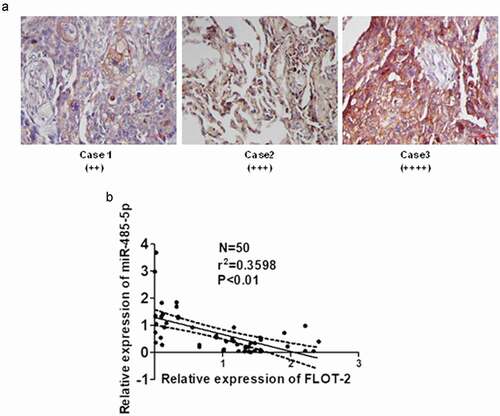
Figure 8. Relationship between MiR-485-5p level and FLOT2 expression in SCLC tissues. (a), immunohistochemical staining of FLOT2 on the tissue sections of SCLC; (b), negative correlation between miR-485-5p and FLOT2 mRNA level; FLOT2 mRNA and miR-485-5p were measured by RT-qPCR, and Pearson correlation analysis shows a negative correlation between miR-485-5p and FLOT2 mRNA level (n = 50, r = −0.5991, p < 0.01).