
Figures & data
Figure 1. Central metabolic pathway in E. coli and the scheme for construction of tryptophan producing strains. Red arrows indicate overexpression of the relevant genes through chromosomal integration or promoter replacement. ‘X’ indicates deletion of the corresponding gene.
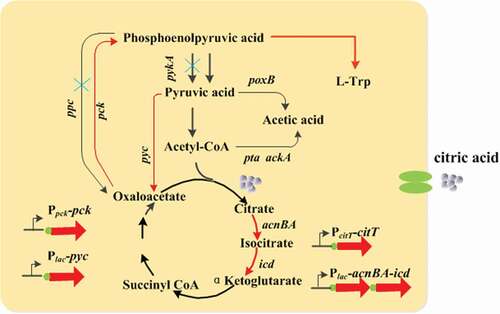
Figure 2. Strategy for multi-step integration and assembly of a large DNA fragment into E. coli chromosome. UH, UH1, and UH2 indicate the upstream homologous sequences, and DH indicates the downstream homologous sequence. P1 and P2 indicate the exogenous protospacer and PAMs from S. pyogenes.
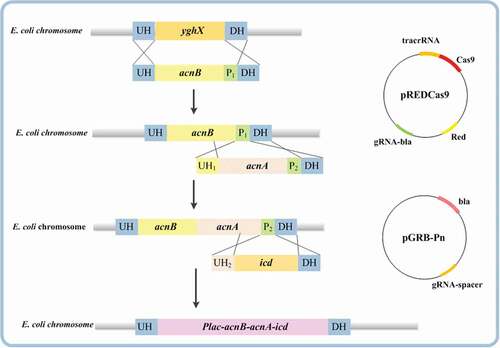
Table 1. Bacterial strains and plasmids used in this study.
Table 2. Primers.
Figure 3. Effect of different modifications on the titer of tryptophan, ‘Blank’ represents strain TRP1.
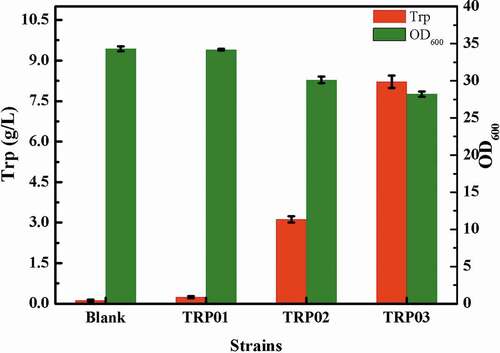
Figure 4. Effect of different modifications of central metabolic pathway on the titer of tryptophan.
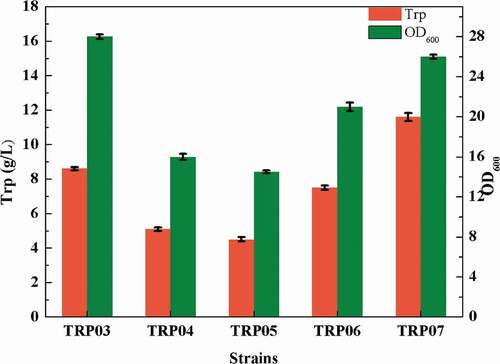
Figure 5. Fed-batch fermentation profiles of the engineered strains TRP03, TRP05, and TRP07 in a 5 L bioreactor. Cell growth (A), tryptophan titer (B), glucose concentration, (C), productivity (D), acetic acid (E), and glutamate (F)are shown. The data shown were chosen as a typical result from a series of experiments.
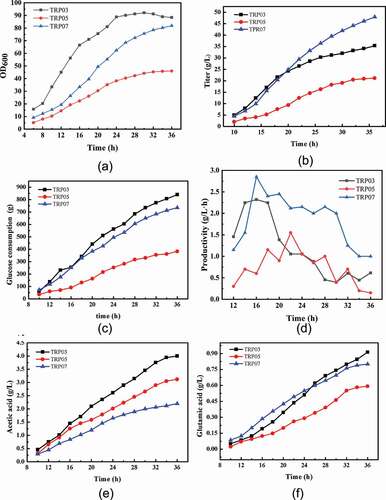
Table 3. Overview on tryptophan production with different strains.