Figures & data
Table 1. MFB micro-electrical stimulation parameters.
Figure 1. An analysis of the training group. The horizontal line represents the training days and the vertical line represents the average number of key presses in two days and three sessions every day. The decrease on the third day is due to the adaptation. The mean and the standard deviation bar of the key presses are shown in the figure.
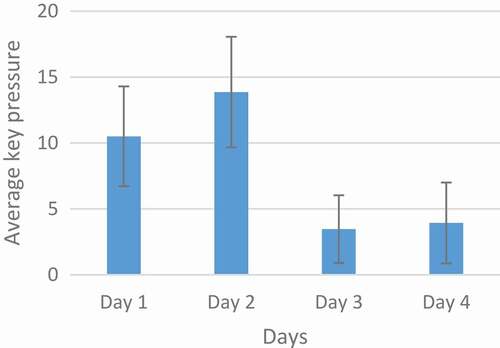
Figure 2. Error bar chart. The standard error is plotted for , which shows a reduction on the third day and the rat’s unwillingness to press the key.
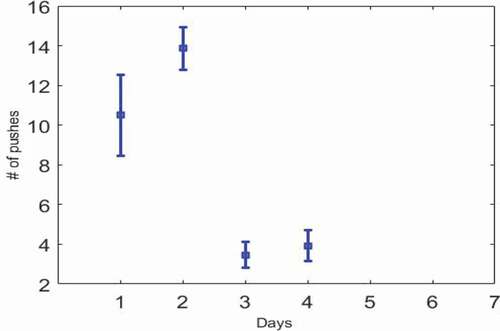
Figure 3. Performance of rats at 100 Hz. Two Rats No. 1 and 5 were tested for a frequency of 100 Hz, but they did not have a regular process during the days and sessions.
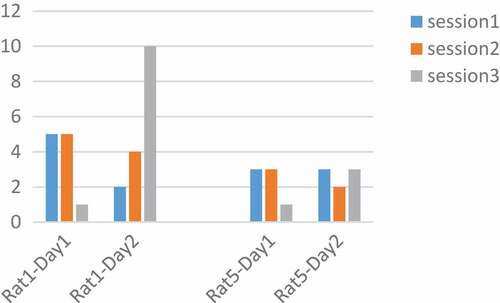
Figure 4. Performance of rats at 250 Hz. The number of pressed keys were reduced during the day and in three sessions. Adaptation occurred at a frequency of 250 Hz.
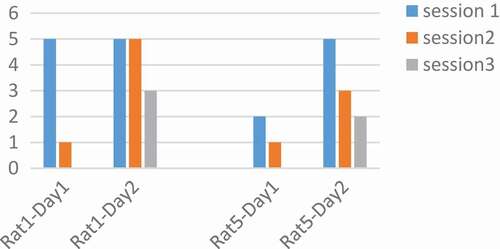
Figure 5. Performance of rats at 400 Hz. Two Rats No. 1 and 5 were tested for a frequency of 400 Hz, but according to the figure, they did not have a regular process during the days and sessions.
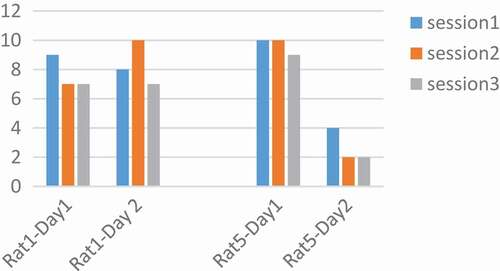
Figure 6. An analysis of the optimum frequency. The blue color indicates Rat No. 1 and the orange color indicates the Rat No 5 at three frequencies of 100, 250, and 400 Hz. The average key pressure in both rats dropped at 250 Hz, rising again at 400 Hz. The best response to stimulation was at 400 Hz.
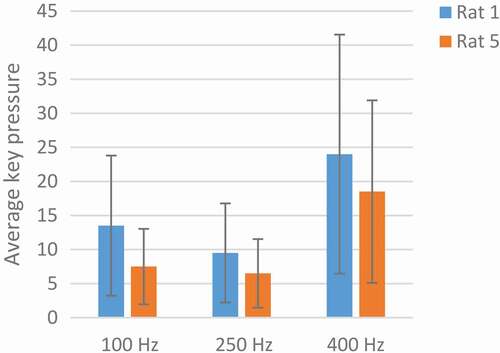
Figure 7. Performance of rats at 90 µA. Rats No 1,3 with 20 biphasic pulse, amplitude:90µ A, pulse width:500 µs, frequency: 100 Hz.
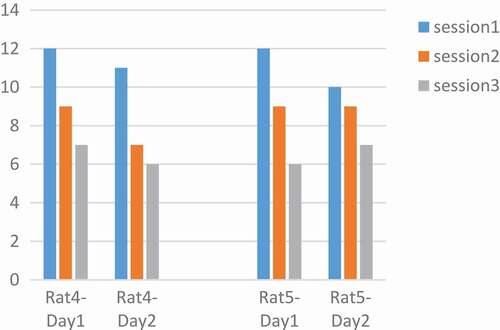
Figure 8. Performance of rats at 130 µA. Rats No 4,5 with 20 biphasic pulse, amplitude:130 µA, pulse width:1000 µs, frequency:100 Hz.
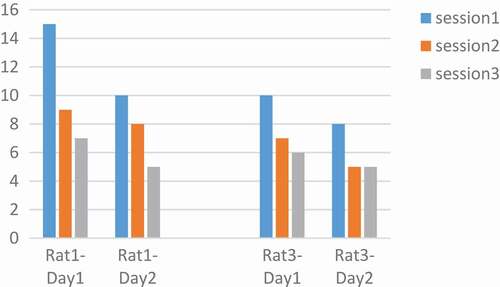
Figure 9. Analysis of optimal amplitude. Rat No.1,3 both are in increasing mood and there is no adaptation to stimulation but rat No.4,5 have a little decrease at 170 µA. the difference between the two groups is because of their different pulse width. 170 µA was an optimum stimulation parameter because rats press the key more than others.
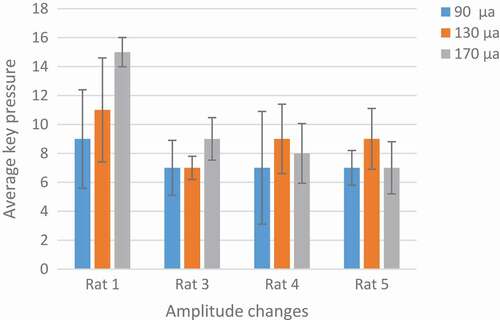
Figure 10. Performance of rats at 260 µs.
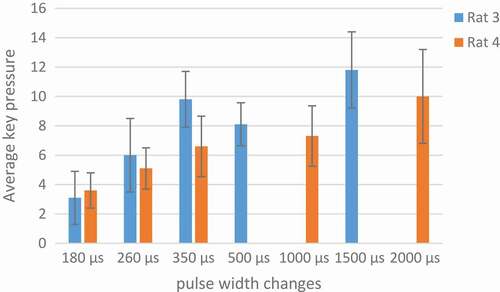
Figure 11. An analysis of optimum pulse width.