
Figures & data
Figure 1. S100A9 mRNA levels in 56 osteosarcoma tissues and 39 normal bone tissue samples. The relative expression level of S100A9 was normalized to b-actin. (a) Box plot of S100A9 expression levels in osteosarcoma tissues and normal bone tissues. The boxes indicate the 25th and 75th percentiles, and the bold lines represent the median values. The relative expression levels of S100A9 were normalized to b-actin. Statistically significant differences were determined using Mann–Whitney tests or Kruskal–Wallis tests. B. Receiver operating characteristics (ROC) curve analysis of the diagnostic value of S100A9.
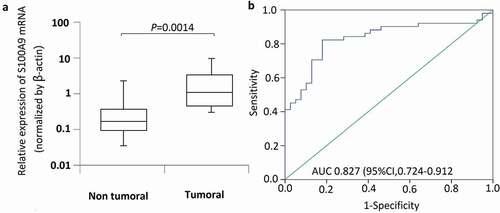
Figure 2. Immunohistochemistry studies and microdissection-based quantitative analysis of S100A9. (a) Immunoreactivities of S100A9; representative images of positive and negative S100A9 expression in normal bone tissues; representative images of positive and negative S100A9 expression in OS tissues. Original magnification, × 200. (b) A microdissection technique was used to isolate normal bone tissues and OS tissues from frozen sections, and total RNA extracted from these cells was subjected to quantitative analysis of S100A9 mRNA using real-time PCR. Differential expression of S100A9 mRNA was observed between normal bone tissues and OS tissues (P = 0.0002).
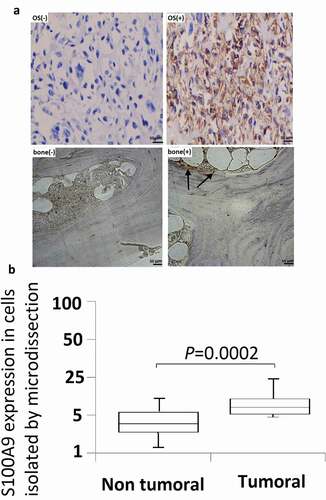
Figure 3. Effect of S100A9 silencing on cell proliferation. (a) S100A9 mRNA expression in 6 OS cell lines. Expression of S100A9 mRNA was normalized to that of b-actin mRNA. All six OS cell lines were positive for the expression of S100A9 mRNA. The median value was 2.6. MG63 and U2OS cells showed moderate expression of S100A9 mRNA. (b) RNAi induced inhibition of S100A9 mRNA. Two siRNAs against S100A9 were designed (siRNA1 and siRNA2). siRNA (100 pmol) was transfected into cancer cells with the Nucleofector reagent. S100A9 mRNA expression was evaluated in MG63 (a) and U2OS (b) cells at 24 h (a) and/or 48 h (a and b) after transfection. Both siRNAs showed efficient inhibition of transcript expression. Inhibition by siRNA2 was stronger than that by siRNA1. (c) Effect of inhibition of S100A9 mRNA on the proliferation of MG63 (a) and U2OS (b) cells. Cells were seeded after transfection of siRNA and evaluated by MTT assay on days 1, 2, and 4 (a) or on days 1, 3, and 5 (b) after transfection. The proliferation of MG63 and U2OS cells was inhibited. The degree of inhibition of cell proliferation was correlated with that of S100A9 mRNA in MG63 cells.
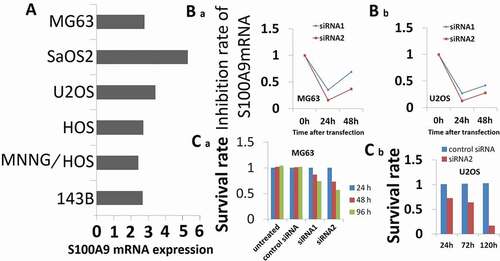
Figure 4. Effect of inhibition of S100A9 mRNA on the invasive potential of MG63 (A and B) and U2OS (C) cells. For invasion assays, cells transfected with siRNA were seeded in a cell migration chamber with the inner well coated with Matrigel (40 ug for MG63, 20ug for U2OS) and incubated for 48 h (MG63) or 72 h (U2OS). The number of cells invading through the Matrigel-coated membrane was then counted. (a) Representative photomicrographs of MG63 cells treated with control siRNA (a), siRNA1 against S100A9 (b), and siRNA2 against S100A9 (c). Original magnification, ×100. (b) There were significant differences in the number of invading cells between the groups (P = 0.026, control siRNA versus siRNA1 against S100A9; P = 0.017, control siRNA versus siRNA2). (c) Representative photomicrographs of U2OS cells transfected with control siRNA (a) or siRNA2 against S100A9 (b). Original magnification, ×100.There was a significant difference between the two groups (P = 0.002).
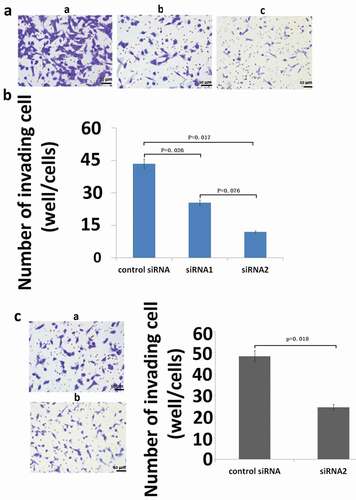
Table 1. List of nine upregulated genes after transfection of siRNA against S100A9.
Table 2. List of nine downregulated genes after transfection of siRNA against S100A9.