Figures & data
Figure 1. Comparison of the transcript levels of four UPR-related genes in RML-expressed strain before and after adding propeptide.
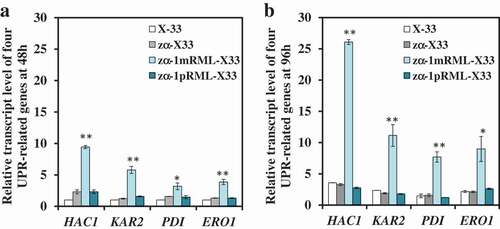
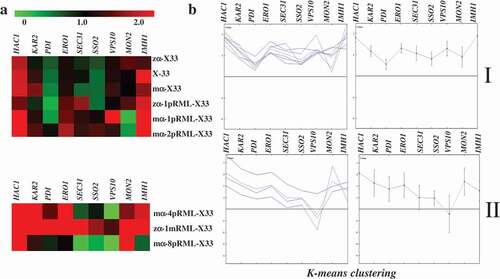
Figure 2. Comparison of the transcript levels of nine genes participated in UPR, protein transport and Golgi-QC system before and after optimizing signal peptide codons.
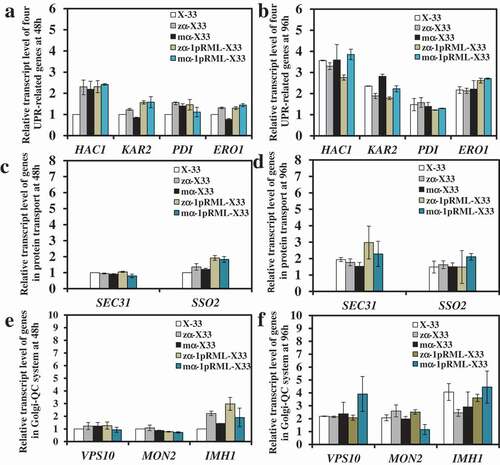
Figure 3. Comparison of the transcript level of genes participated in UPR and Golgi-QC system in the strains with different lipase gene dosage.
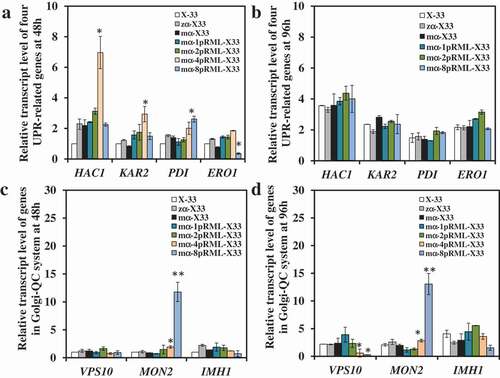
Figure 4. Detection by Western blotting of intracellular lipase in four recombinant strains.
Table 1. Parameters of lipase produced by recombinant strains containing different copy number of the prml gene.
Figure 5. Transcription levels and HCL of nine target genes related to protein synthesis and secretion pathway in different strains at 96 h.