Figures & data
Table 1. Sequences of specific primer pairs used for cloning procedures.
Figure 1. SDS-PAGE analysis of CotA-laccase. Protein samples were loaded in each lane as follows: cell extract wild-type CotA (lane 1), cell extract 5E29 CotA (lane 2), molecular weight marker (M), purified wild-type CotA (lane 3), purified 5E29 CotA (lane 4).
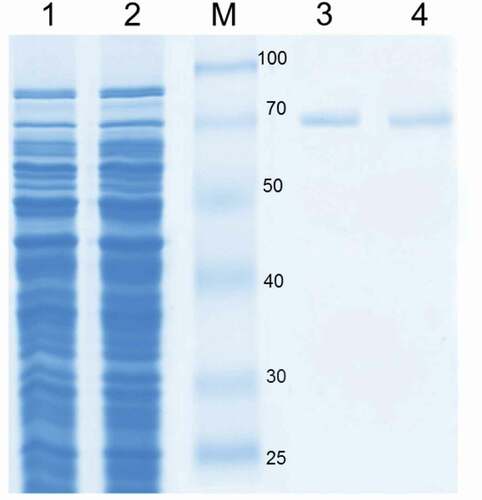
Table 2. Kinetic constants for the wild-type CotA and 5E29 mutant using SGZ as substrate.
Figure 2. Effect of pH on the activity (a) optimal pH of wild-type CotA and 5E29 mutant for catalyzing ABTS and SGZ; (b) pH stability of wild-type CotA and 5E29 mutant.
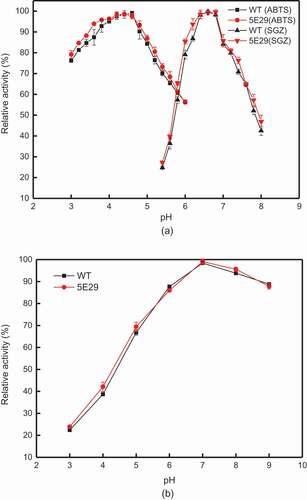
Figure 3. Effect of temperature on the activity (a) optimal temperature of wild-type CotA and 5E29 mutant for catalyzing SGZ; The thermostability of wild-type CotA and 5E29 mutant (b) at 60°C, (c) 70°C, (d) 80°C.
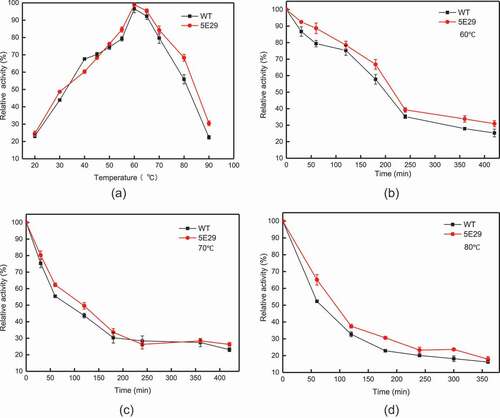
Figure 4. Local structure of the wild-type laccase and its variants. (a) The position of Gln367 and neighboring residues of the wild-type laccase (b) Gln-367-Arg.
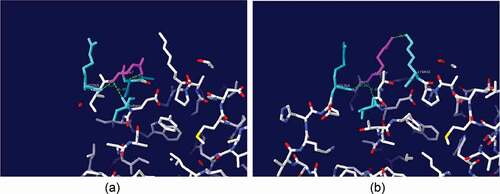
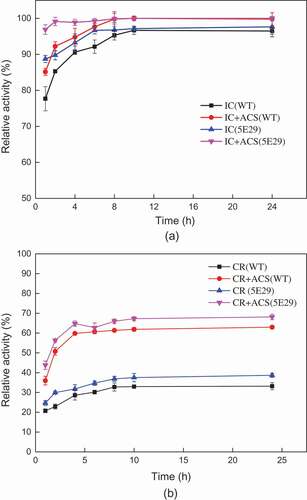
Figure 5. Decolorization of synthetic dyes by 5E29 and the wild-type CotA-laccases. (a) IC: Indigo carmine (b) CR: Congo Red.