Figures & data
Table 1. Culture conditions of each group.
Table 2. Primers used for the analysis of mRNA levels by qRT-PCR.
Table 3. The primers used for MeDIP-PCR.
Figure 1. The effect of 5-Aza-CdR on the expression of inflammatory cytokines in hDPCs. (a) Cell culture media was collected from untreated hDPCs, 5-Aza-CdR-treated hDPCs, LPS-induced hDPCs, and 5-Aza-CdR-pretreated and LPS-induced hDPCs and subjected to human cytokine antibody arrays to assess the secretion of 42 cytokines. (b) The relative quantitative analysis of antibody arrays. The results are presented as means ± SD of three independent experiments; *P <0.05.
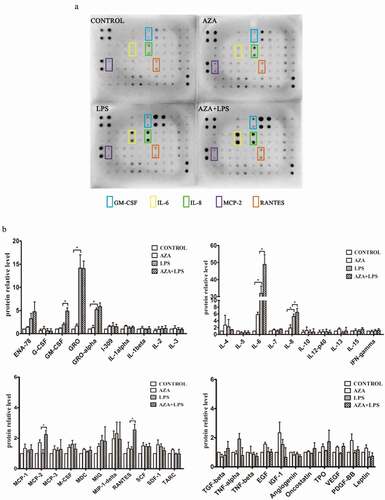
Figure 2. The differential expression of inflammatory cytokines induced by LPS in hDPCs with or without 5-Aza-CdR pretreatment. (a) Cells were collected from LPS-treated hDPCs with or without 5-Aza-CdR pretreatment. The mRNA expression of IL-6 was measured by qRT-PCR. (b) Cells were collected from LPS-treated hDPCs with or without 5-Aza-CdR pretreatment. The mRNA expression of IL-8 was measured by qRT-PCR. (c) Cell culture media were collected from LPS-treated hDPCs for 24 h with or without 5-Aza-CdR pretreatment. The protein expression level of IL-6 was measured by ELISA. (d) Cell culture media was collected from LPS-treated hDPCs for 24 h with or without 5-Aza-CdR pretreatment. The protein expression level of IL-8 was measured by ELISA. The results are presented as the mean ± SD of three independent experiments; *P <0.05; **P < 0.01.
Figure 3. Effects of 5-Aza-CdR pretreatment on LPS-induced activation of the NF-κB and MAPK signaling pathways in hDPCs. Cells were pretreated with 10 µM/l 5-Aza-CdR for 48 h followed by stimulation with 1 µg/ml LPS. (a) The phosphorylation of IKKα/β, IκBα, and p65 in the NF-κB pathway was examined by western blot. GAPDH was used as an internal control. (b) The histogram shows the relative quantitative analysis of phosphorylation of IKKα/β, IκBα, and p65 in cells pretreated with 5-Aza-CdR compared to cells treated with LPS alone. (c) The phosphorylation of p38, ERK, and JNK in the MAPK pathway was examined by western blot. GAPDH was used as an internal control. (D) The histogram shows the relative quantitative analysis of the phosphorylation of p38, ERK, and JNK in cells pretreated with 5-Aza-CdR compared to that in cells treated with LPS alone. The results are presented as the mean ± SD of three independent experiments; *P <0.05; **P < 0.01.
Figure 4. The effects of 5-Aza-CdR on the 5mC levels of the MyD88, TRAF6, IL-6 and IL-8 gene promoters in hDPCs. Dynamic methylation levels of the MyD88, TRAF6, IL-6 and IL-8 gene promoters were evaluated with MeDIP-PCR in the 5-Aza-CdR and control groups after 6 h of LPS stimulation. The results are presented as the mean ± SD of three independent experiments; *P < 0.05; **P < 0.01.