Figures & data
Table 1. The relationship between sCLU expression and clinicopathological features of osteosarcoma.
Figure 1. sCLU immunoreactivity in normal bone, fibrous dysplasia, ossifying myositis, and OS tissues. The ‘−’ and ‘+’ symbols in the cytoplasm of cells indicate negative and positive staining, respectively (200× magnification).
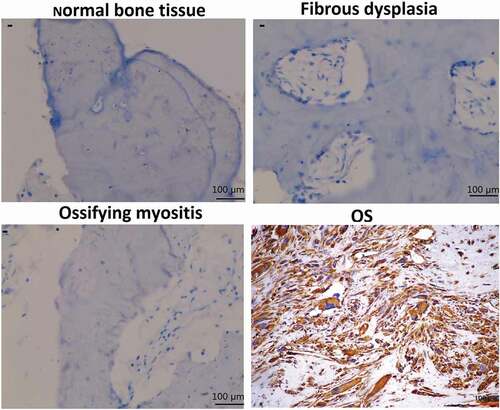
Figure 2. Association between sCLU protein expression and clinical outcome in OS patients. A, B, Kaplan–Meier curves depicting overall survival (a) and disease-free survival (b) rates in OS patients positive and negative for sCLU expression.
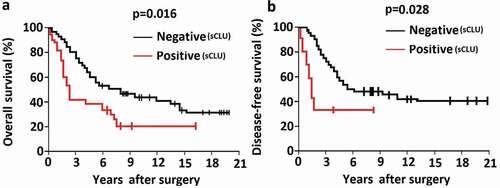
Figure 3. Effect of sCLU silencing on apoptosis, viability, proliferation, and invasion of KHOS cells in vitro. (a), Cells were transfected with sCLU siRNA for 24–72 h, and sCLU protein expression was detected by western blotting. (b), sCLU protein expression in KHOS cells stably transfected with sCLU shRNA was detected by western blotting. (c), Effects of sCLU or control siRNA transfection on the viability of KHOS cells. **P < 0.05, **P < 0.01. (d), Representative results of the colony formation assay for KHOS cells transfected with control or sCLU shRNA. **P < 0.01. (e), Effects of sCLU or control siRNA transfection on KHOS cell apoptosis. **P < 0.01. (f), Evaluation of KHOS cell invasion with the transwell assay following sCLU knockdown. **P < 0.01. Scale bar, 50 μm. Results are representative of three independent experiments.
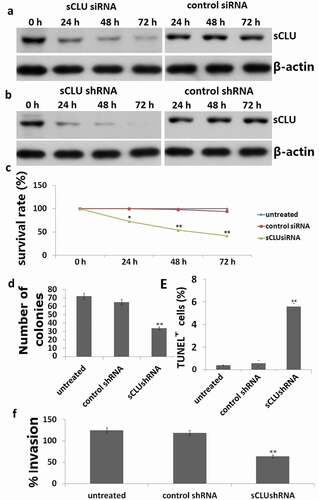
Figure 4. Effect of sCLU knockdown combined with Gem treatment on apoptosis and viability of KHOS cells. (a), KHOS cells were transfected with sCLU or control siRNA with or without Gem treatment (1–20 μg/ml) for 48 h; cell viability was detected with the MTT assay. (b), KHOS cells were transfected with sCLU or control siRNA with or without Gem treatment (10 μg/ml) for 48 h; cell apoptosis was detected with the TUNEL assay. *P < 0.05, **P < 0.01.
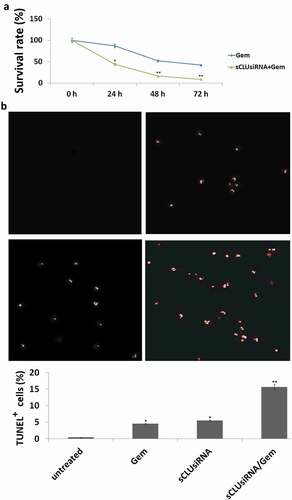
Figure 5. Combined effect of sCLU silencing and Gem treatment in a mouse xenograft model. (a), Stable sCLU or control shRNA clones were implanted into nu/nu mice (n = 5); when the tumor diameter was 0.06–0.1 cm3, the mice were treated with Gem. Tumor volume was calculated as described in Methods. *Combined P = 0.026 vs. Gem or sCLU shRNA. (b), Bioluminescence images of tumors in mice implanted with stable sCLU or control shRNA clones and treated with Gem at 5 weeks post-treatment. (c), TUNEL staining of tumor tissues. (d), Effect of sCLU knockdown on the formation of metastatic lesions in an orthotopic lung mouse xenograft model. Representative gross images of lungs show multiple massive tumors (arrows) in a mouse from the control shRNA group, in contrast to the minuscule tumor in a mouse from the sCLU shRNA group. (e), Micrographs of hematoxylin and eosin-stained tumors in control and sCLU shRNA group mice. Scale bar, 50 μm.