Figures & data
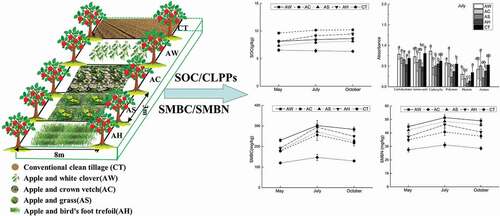
Table 1. Soil moisture (means and standard deviations) seasonal dynamics under indicated cover crops.
Figure 1. Soil organic carbon contents (mean ± standard deviation) under indicated cover crops.
Table 2. Average well color development (means and standard deviations) of samples of soil under indicated cover crops after 120 h incubation.
Figure 2. Biolog absorbance readings showing the efficiency of utilization of indicated carbon sources by samples for the soil under indicated covering crops in May, July and October.
Table 3. Diversity indices (means and standard deviations) of soil microbial communities under indicated cover crops.
Table 4. Summary results of the analysis of variance of effects of practices, time and soil depths on indices of microbial functional diversity and utilization of indicated carbon sources.
Figure 3. Correlation analysis results in three seasons (solid line means there was a significant correlation between two factors and p-value<0.01; dotted line means there was a significant correlation between two factors and p-value<0.05).
Figure 4. Soil microbial biomass carbon and nitrogen contents (mean ± standard deviation) under indicated cover crops.