1,634
Views
1
CrossRef citations to date
0
Altmetric
Research Paper

Screening and enzymatic activity of high-efficiency gellan lyase producing bacteria Pseudoalteromonas hodoensis PE1

ORCID Icon, , , , , , , , & show all
Pages 240-249 | Received 21 Apr 2019, Accepted 30 May 2019, Published online: 17 Jun 2019

Figures & data

Figure 1. Screening plate pit. Gellan was the coagulant and the sole carbon source; as it was degraded by lyase, obvious pits would be produced on the plate. Thus, high-efficiency gellan lyase producing bacteria could be obtained by isolating and purifying the strains in the pits.

Figure 1. Screening plate pit. Gellan was the coagulant and the sole carbon source; as it was degraded by lyase, obvious pits would be produced on the plate. Thus, high-efficiency gellan lyase producing bacteria could be obtained by isolating and purifying the strains in the pits.

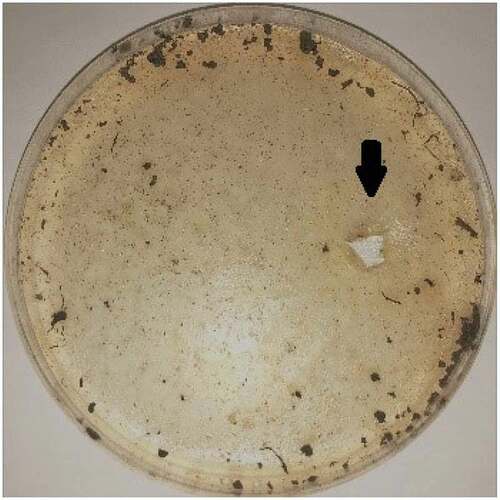
Table 2. Four strains of gellan lyase producing bacteria.

Figure 2. Phylogenic tree of Pseudoalteromonas hodoensis with related species. Neighbor-joining tree based on 16S rDNA sequences shows the position of Pseudoalteromonas hodoensis. The marker bar denotates the relative strain similarity.

Figure 2. Phylogenic tree of Pseudoalteromonas hodoensis with related species. Neighbor-joining tree based on 16S rDNA sequences shows the position of Pseudoalteromonas hodoensis. The marker bar denotates the relative strain similarity.

Figure 3. Strain streaking and purification plate, scanning electron microscopy and gram-staining. (a) Strain streaking and purification plate, forming a pale yellow and opaque colony size of 2–3.5mm. (b) Strain scanning electron microscopy, the specific morphology of the bacterial strain was observed by scanning electron microscopy. There was no obvious flagellum and the dimension ranges were 2.2–3.1 μm long, 0.4–0.9 μm wide. (c) The result of gram staining which was red under a light microscope was gram-negative bacteria.

Figure 3. Strain streaking and purification plate, scanning electron microscopy and gram-staining. (a) Strain streaking and purification plate, forming a pale yellow and opaque colony size of 2–3.5mm. (b) Strain scanning electron microscopy, the specific morphology of the bacterial strain was observed by scanning electron microscopy. There was no obvious flagellum and the dimension ranges were 2.2–3.1 μm long, 0.4–0.9 μm wide. (c) The result of gram staining which was red under a light microscope was gram-negative bacteria.

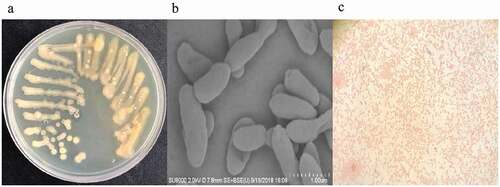
Table 3. Physiological activity detection results.

Table 1. Effect of various ions and inhibitors on gellan lyase activity (unit:U/ml).

Figure 4. The optimum temperature reaction conditions for gellan lyase (unit:U/ml) .The enzyme was preincubated at pH 7.0 in 50 mM Tris–HCl buffer, with different temperature gradients. The lyase activity was determined by spectrophotometry at 235nm every 30 min.

Figure 4. The optimum temperature reaction conditions for gellan lyase (unit:U/ml) .The enzyme was preincubated at pH 7.0 in 50 mM Tris–HCl buffer, with different temperature gradients. The lyase activity was determined by spectrophotometry at 235nm every 30 min.

Figure 5. The optimum pH reaction conditions for gellan lyase (unit:U/ml).The enzyme was preincubated at 30°C in 50 mM Tris–HCl buffer, with different pH gradients. The lyase activity was determined by spectrophotometry at 235nm every 30 min.

Figure 5. The optimum pH reaction conditions for gellan lyase (unit:U/ml).The enzyme was preincubated at 30°C in 50 mM Tris–HCl buffer, with different pH gradients. The lyase activity was determined by spectrophotometry at 235nm every 30 min.

Figure 6. TLC profile of the gellan degradation product after 48h incubation. Lane 1, gellan (0.05%); lane 2, rhamnose (1%); lane 3, glucose (1%); lane 4, gellan degradation product after 48h incubation.

Figure 6. TLC profile of the gellan degradation product after 48h incubation. Lane 1, gellan (0.05%); lane 2, rhamnose (1%); lane 3, glucose (1%); lane 4, gellan degradation product after 48h incubation.

Figure 7. HPLC analysis of the gellan degradation products. Gellan was converted to a tetrasaccharide (4,5-ene-glucuronyl-glucosyl-rhamnosyl-glucose) by the gellan lyase.

Figure 7. HPLC analysis of the gellan degradation products. Gellan was converted to a tetrasaccharide (4,5-ene-glucuronyl-glucosyl-rhamnosyl-glucose) by the gellan lyase.