Figures & data
Figure 1. TGF-β1-stimulated EMT in 8505C cells. (a) Time effect of TGF-β1 on EMT were examined by morphologic changes in 8505C, 200× magnification. (b) Immunofluorescence stains: Cultured 8505C cells after TGF-β1 treatment were stained with monoclonal antibodies against E-cadherin, cytokeratin, vimentin and F-actin. (c) Expression EMT markers in TGF-β1–stimulated 8505C cells was detected by western blot assay.
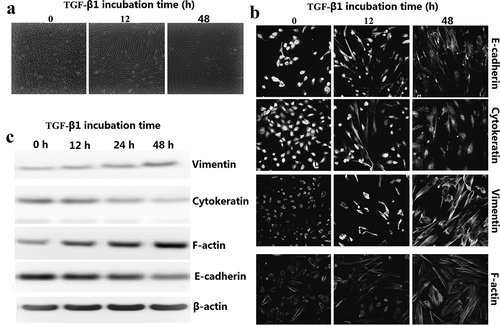
Figure 2. Effects of EGCG on TGF-β1-induced epithelial-to-mesenchymal transition (EMT) in vitro. 8505C cells were pretreated for 1 h with EGCG, followed by incubation with TGF-β1 for 48 h. (a) Expression of EMT markers in TGF-β1-stimulated 8505C cells was detected by western blot assay. (b) Immunofluorescence double staining for E-cadherin (red) and vimentin (red) in TGF-β1-stimulated 8505C after treatment of EGCG. Cells was counterstained with Hoechst 33342 (blue). Magnifications ×200; (c) Expression of the E-cadherin transcription repressors in TGF-β1-stimulated 8505C cells was detected by western blot assay. The data are representative of three similar experiments and quantified as mean values ± S.E, vs control, aP<0.05; vs TGF-β1,bP<0.05.
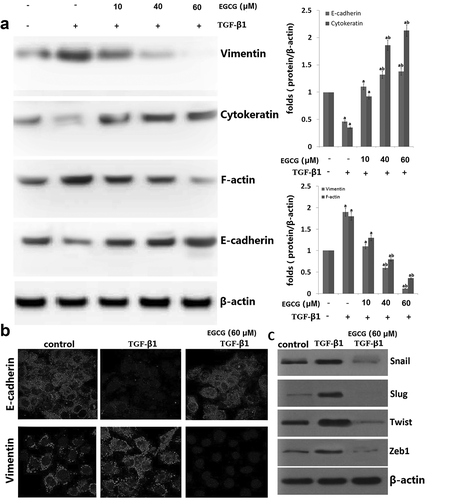
Figure 3. EGCG antagonizes the TGF-β1-stimulated Smad signal pathway in vitro. Cells were pretreated for 1 h with EGCG, followed by incubation with TGF-β1 for 24 h. (a) Nuclear extracts were subjected to SBE DNA binding and Smad4 antibody (Ab) assay by EMSA supershift assay; (b) EGCG inhibits TGF-β1-dependent transcriptional activity of the CAGAx12-Luc reporter in a dose-dependent manner; (c) Immunoblot of the effect of EGCG on the TGF-β1-stimulated pSmad2, pSamd3 and Smad4; (d) 8505C was transfected with control (Con) or specific Smad4 siRNA and then treated with TGF-β1 for 24 h or 48 h. The quantitative ratios are shown as relative optical densities of bands that are normalized to the expression of β-actin. The data are representative of three similar experiments and quantified as mean values ± S.E. ap < 0.05 versus normal control, abp < 0.05 versus TGF-β1 treatment.
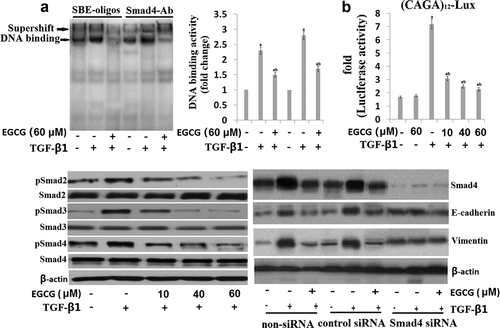
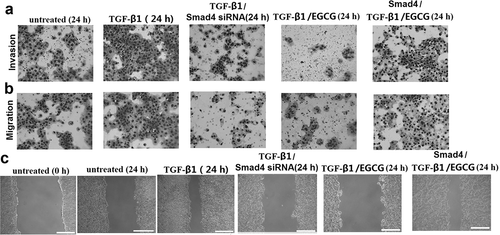
Figure 4. EGCG inhibits invasion and migration of 8505C cells via TGF-β/Smad4 Signal transduction pathway. 8505C cells were maintained in growth media supplemented with 5 ng/mL TGF-β with or without EGCG (60 μM) for 24 h. Or the 8505C cells were transfected with Smad4 siRNA or treated with Smad4 24 h before the TGF-β with or without EGCG treatment. (a) Boyden chamber assay performed to evaluate cell invasion; (b) Boyden chamber assay performed to evaluate migration; (c) Cell migration determined by the wound-healing assay. Magnification ×100 and scale bars = 100 μm.