Figures & data
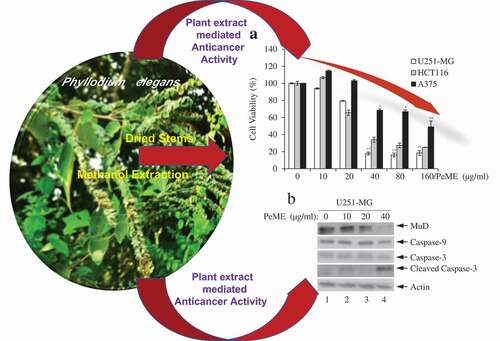
Table 1. Identification of major polyphenols in the methanolic extract of P. elegans by Liquid chromatography (LC)-electrospray ionization (ESI) -tandem mass spectrometric (MS/MS), and LC-ESI-MS/MS-multiple reaction monitoring (MRM) analysis.
Figure 1. Cytotoxic effects of P. elegans methanolic extract (PeME)-treated glioblastoma, colon, and melanoma cancer cells. Cells were incubated for 24 h with various concentrations of PeME (0, 10, 20, 40, 80 and 160 μg/ml). (a). Cell viability was determined using WST-1 assay. Experiments were done in triplicates (n = 3) and the results were statistically significant at *P < 0.05, **P < 0.01. (b). PeME treatment changed the cell morphology and inhibited the proliferation rate of glioblastoma, colon, and melanoma cancer cells. Cells were exposed to PeME at 0, 20, 40, and 80 µg/ml concentrations respectively. The cellular morphological changes were examined at 24 h of treatment and imaged under an inverted phase-contrast microscope (100x magnification).
Figure 2. P. elegans methanolic extract (PeME) treatment showed the anti-metastatic effect and reduced the cell migration rate of the U251-MG, HCT116, and A375 cells. Wound closure ability of control and treated U251-MG (10 and 20 µg/ml), HCT116 (10 and 20 µg/ml), and A375 cells (40 and 80 µg/ml) were shown. The image of wounded wells was captured with the help of an inverted phase-contrast microscope at 0, 12, 24, 36 h (100x magnification).
Figure 3. Apoptotic features in P. elegans methanolic extract (PeME) treated glioblastoma, colon, and melanoma cancer cells. (a–c) showed control, 20 and 40 µg/ml treated U251-MG and (d–f) showed control, 20 and 40 µg/ml treated HCT116 incubated for 24 h. Changes in the morphology of the cancer cells were observed under fluorescence microscope (200x magnification).
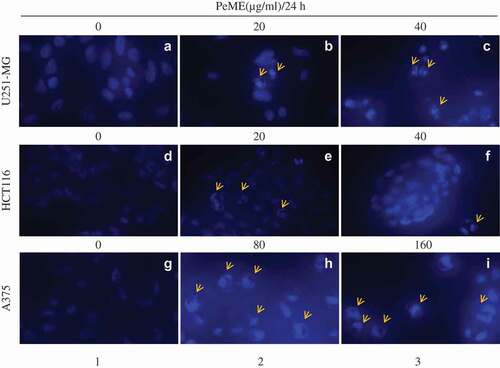
Figure 4. Flow cytometry analysis of U251-MG, HCT116, and A375 cell lines after P. elegans methanolic extract (PeME) treatment for 24 h. All cells were labeled with annexin V-FITC and PI. U251-MG cells (a) treated at 0,10, 20, and 40 µg/ml concentration of PeME, HCT116 cells (b) were treated for 0, 20, 40, and 80 µg/ml. (b), A375 cells (c) were treated 0, 40, 80, and 160 µg/ml. FACs analysis was performed and analyzed. Data presented are representative of three experiments.
Figure 5. Analysis of caspase and MuD activation in U251-MG, A375, and HCT116 cell lines. Cells were treated with various concentrations of PeME for 24 h; U251-MG were treated with 0, 10, 20 and 40 µg/ml (a), HCT116 cells were treated with 0, 10, 20, 40 and 80 µg/ml (b), A375 cell were treated with 0, 40, 80 and 160 µg/ml (c). The lysates were analyzed by immunoblotting using anti-caspase-3/-9 and MuD MAb. Actin was used for loading control.
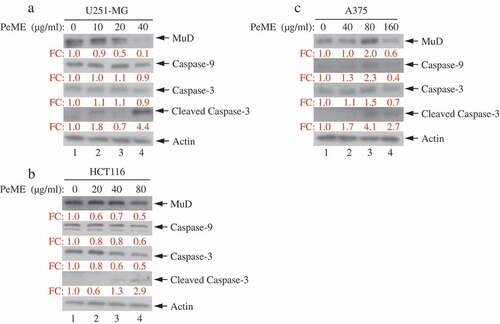
Figure 6. P. elegans methanolic extract (PeME) alleviated mitochondrial membrane potential (MMP). PeME induced a significant reduction in MMP in three cells. a-d showed control, 20, 40, and 80 µg/ml treated U251-MG; e-h showed control, 20, 40, and 80 µg/ml treated HCT116; i-l showed control, 40, 80, and 160 µg/ml treated A375 cells. Histogram profiles of JC-1 monomer (green fluorescence) were detected using flow cytometry. Peaks of treated concentration were shifted toward the right in the three treated cells compared to control, indicating a reduction of MMP.