Figures & data
Figure 1. LOC285194 regulates proliferation and apoptosis in HA-VSMC cells. (a) LOC285194 transcript expression in atherosclerotic plaques of ApoE-/- mice and wild-type control mice (WT) was measured by qRT-PCR. It showed that the expression of LOC285194 was lower in atherosclerotic plaques of ApoE-/- mice compared to WT. (b) Si-RNAs were designed to knockdown LOC285194 in HA-VSMCs. Relative quantification of LOC285194 mRNA expression by qRT-PCR is shown as mean ± SD of three independent experiments. (c) The expression of LOC285194 was quantified by qRT-PCR in HA-VSMC cells transfected into Lv- LOC285194 or Lv-control. (d) The proliferation and viability of HA-VSMC cells were measured using the Cell Counting Kit-8 (CCK-8) colorimetric assay after LOC285194 knockdown. (e) The proliferation and viability of HA-VSMC cells were measured using the Cell Counting Kit-8 (CCK-8) colorimetric assay after LOC285194 overexpression. (f) The cell apoptosis of HA-VSMC cells were measured using the Annexin-V conjugated FACS analysis after LOC285194 overexpression. * P < 0.05 relative to control
Figure 2. LOC285194 regulates cell invasion and migration in HA-VSMC cells in vitro. (a) Knockdown of LOC285194 by LOC285194 siRNA increased invasion in HA-VSMC cells in vitro by transwell assays; LOC285194 overexpression by Lv- LOC285194 transfection decreased invasion in HA-VSMC cells in vitro by transwell assays. Representative images at 24 h of the transwell assay are shown (×200). (b) Knockdown of LOC285194 by LOC285194 siRNA increased migration in HA-VSMC cells in vitro by wound healing assays; LOC285194 overexpression by Lv- LOC285194 transfection decreased migration in HA-VSMC cells in vitro by wound healing assays. Representative images at 0 h and 24 h of the wound-healing assay are shown (×4)
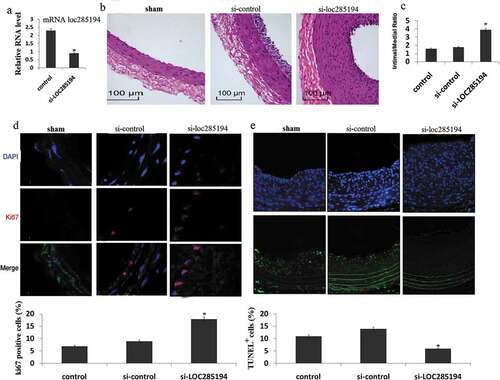
Figure 3. Inhibition of LOC285194 results in increased neointima formation. LOC285194 transcript expression in injured area of mouse carotid arteries measured by qRT-PCR. (a)LOC285194 mRNA expression was significantly higher in injured area of mouse carotid arteries compared to the control. (b) Lentivirus vectors for LOC285194 knockdown (si- LOC285194), or control si-RNA were in-site injected into the injured area of mouse carotid arteries. Sham operation serves as controls. Carotid arteries were harvested 30 days later after feeding mice with high-fat diet. H&E staining was performed to show the thickness of neointima. (c) Quantification of the intima-media thickness of sham, control si-RNA and si- LOC285194 treated samples. (d) Representative immunofluorescence images of Ki67 in mouse carotid arteries. DAPI staining marks cell nuclei. Quantification of the Ki67 positive signals of sham, control siRNA and si-LOC285194 treated samples. (e) Representative immunofluorescence images of TUNEL staining in mouse carotid arteries. DAPI staining marks cell nuclei. Quantification of the TUNEL positive signals of sham, control si-RNA and si- LOC285194 treated samples. All values are the average of at least 3 biological replicates and data shown are the mean±SD. * P < 0.05 relative to control