Figures & data
Figure 1. Treatment with COTI-2 results in caspase activation and apoptosis in dose- and in time-dependent manners in Jurkat cells. (a), Jurkat cells were treated with 0, 50, 100, 150, and 200 nM COTI-2 for 48 h. (b) The cells were treated with 200 nM BITC for 0–48 h. In (a) and (b), cells were stained with Annexin V/PI, and the percentage of apoptotic cells was determined using flow cytometry. (c,d), After treatment with COTI-2, total cellular extracts, nuclear extracts, and cytosolic fractions were prepared and subjected to western blot analysis using antibodies against PARP, cleaved-caspase (C-Caspase)-9, cleaved-caspase-3. Each lane was loaded with 30 mg of protein. Two additional studies yielded equivalent results
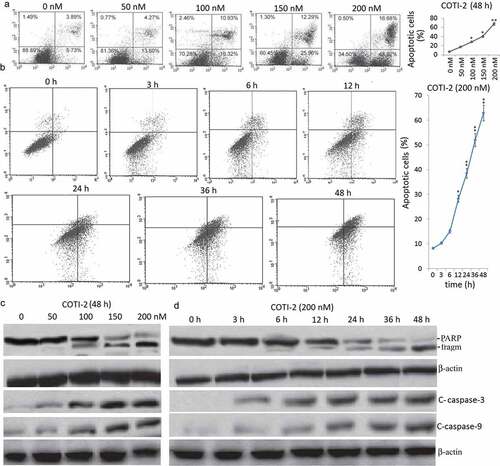
Figure 2. Treatment with COTI-2 results in increased miR-203 expression in dose- and in time-dependent manners in Jurkat cells. (a), Jurkat cells were treated with 0, 50, 100, 150, and 200 nM COTI-2 for 48 h. (b) The cells were treated with 200 nM BITC for 0–48 h. In (a) and (b), miR-203 expression was detected by qRT-PCR assay
Figure 3. Enforced expression of miR-203 enhanced BITC-mediated apoptosis in Jurkat cells. Total cellular extracts were prepared from Jurkat cells transfected with miR-NC (control) and miR-203 mimic, and then subjected to qRT-PCR assay for miR-203 (a), and western blot assay for cleaved caspase-9 and −3 and PARP (b). (c), Jurkat cells transfected with miR-NC or miR-203 mimic were treated with 0, 50, 100, 150, and 200 nM COTI-2 for 48 h. After treatment, cells were stained with Annexin V/PI, and apoptosis was determined using flow cytometry. (d), Jurkat cells transfected with miR-NC or miR-203 mimic were treated with 200 nM COTI-2 for 3–48 h. After treatment, cells were stained with Annexin V/PI, and apoptosis was determined using flow cytometry. Significant difference from controls, Student’s t-test, *p < 0.05; **p < 0.01;***P < 0.001
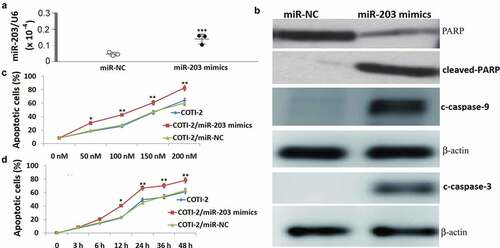
Figure 4. Downregulation of miR-203 inhibited BITC-mediated apoptosis in Jurkat cells. (a), Total cellular extracts were prepared from Jurkat cells transfected with NC inhibitor (control) and miR-203 inhibitor, and then subjected to qRT-PCR assay for miR-203; (b), Jurkat cells transfected with miR-NC or miR-203 mimic were treated with 0, 50, 100, 150, and 200 nM COTI-2 for 48 h. After treatment, cells were stained with Annexin V/PI, and apoptosis was determined using flow cytometry. Significant difference from controls, Student’s t-test, *p < 0.05; **p < 0.01;***P < 0.001
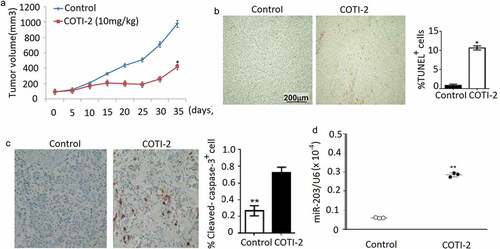
Figure 5. COTI-2 treatment inhibits Jurkat xenograft growth (a). Jurkat cells (5 × 10⁶) were injected into the flanks of mice (n = 5 mice per group). Xenografts were allowed to reach 75 ~ 100 mm3 before IP treatment initiation with COTI-2 (10 mg/kg, 5 days a week for 7 weeks) or saline alone. Tumor growth was measured every 5 days by caliper measurement. (b), Tumors were obtained from animals 35 days after drug exposure. Tumors were fixed and stained to examine apopptosis using TUNEL assay. (c), The levels of cleaved-caspase-3 was detected by immunohistochemistry; (d), The levels of miR-203 was detected by qRT-PCR. Significant difference from controls, Student’s t-test, *p < 0.05. **p < 0.01