
Figures & data
Figure 1. Illustration of sampling time points
Table 1. List of protozoa species recorded at the four layers of soil, including average abundance (ind*ml−1), occurrence, and rank by contribution of each species to the average Bray–Curtis similarity at each of the four layers in sites soil the whole growing period of Beta vulgaris L. May to October 2018. n: average abundance; %: contribution; rank: abundance ranking
Figure 2. Count number of principal living protozoan species noted in the studied soil samples. Depth 1: 0–5 cm; 2: 5–10 cm; 3: 10–15 cm; 4: 15–20 cm
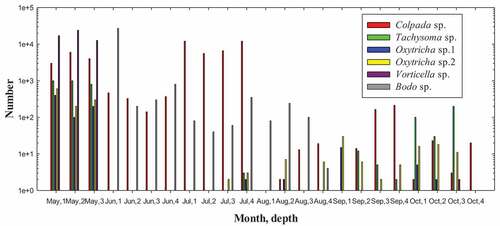
Figure 3. The abundance and occurrence frequency of protozoa in the rhizosphere of B. vulgarisL. and in four layers of soil within 6-months sampling period. 1: 0–5 cm soil, 2: 5–10 cm soil, 3: 10–15 cm soil, 4: 15–20 cm soil
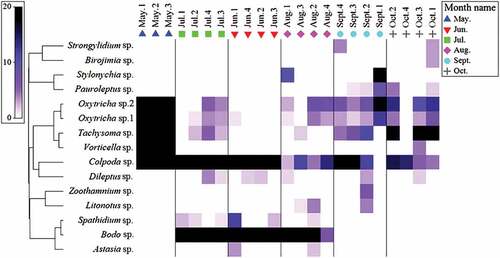
Figure 4. Canonical analysis of principal coordinates on Bray–Curtis similarities from log-transformed species-abundance data in B. vulgaris L. rhizosphere soil from May 2018 to October 2018, and correlations of 5dominant species with the two CAP axes. (a) Time difference analysis, (b) Space difference analysis
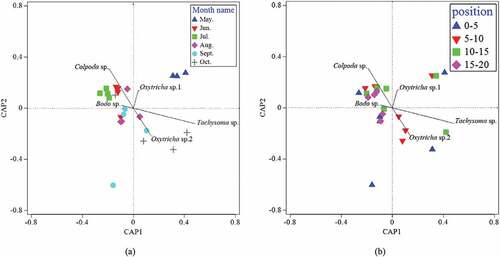
Figure 5. Protozoan diversity indexes of soils and the four layers of soil. Shannon–Wiener index (H’), Pielou evenness index (j), Margalef species richness index (d). 1: 0–5 cm soil, 2: 5–10 cm soil, 3: 10–15 cm soil, 4: 15–20 cm soil
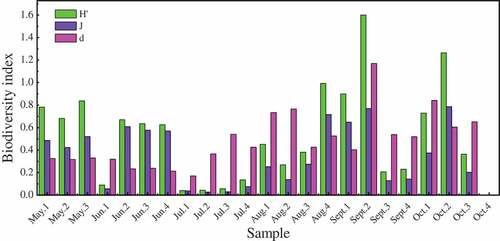
Figure 6. Physiochemical properties of soil samples. (a) left: T, right: pH (b) left: SWC, right: OM (c) left: NH4+-N, right: NO3–N (d) left: TN, right: A-P
Figure 7. Pearson correlation analysis between soil physicochemical properties and protozoan diversity indexes (relative abundance and their ratios). Shannon–Wiener index (H’), Pielou evenness index (j), Margalef species richness index (d).***Significant correlation at p < 0.001 level, **Significant correlation at p < 0.01 level, *Significant correlation at p < 0.05 level
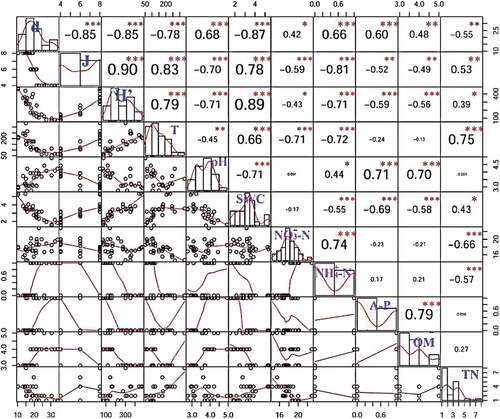
Table 2. Spearman correlation analysis between soil physicochemical properties and protozoa
Figure 8. Pearson correlation analysis between soil physicochemical properties and protozoan (relative abundance and their ratio).**Significant correlation at p < 0.01 level; *significant correlation at p < 0.05 level
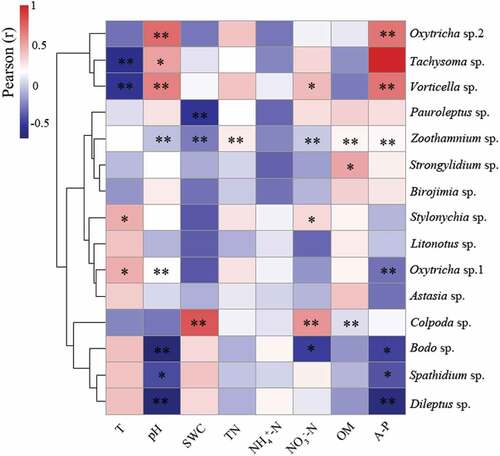
Table 3. Summary of results from biota-environment (BIOENV) analysis showing the eight best matches of environmental variables with temporal variations in protozoa abundances at four layers in B. vulgarisL. rhizosphere soil from May 2018 to October 2018