Figures & data
Table 1. Chemical composition of brewers spent grain, and stale sourdough bread before and after 6 days solid state fermentation by N. intermedia (based on dry weight). The final composition of the fermented fungus product is also compared with a typical composition of hamburger, commercial mycoprotein product (Quorn®, UK) and soybean burger.
Figure 1. Regression lines from the natural log transformation model obtained of the maximum bite force of (a) fried R. oryzae fungal products and (b) fried N. intermedia fungal products on stale sourdough bread with addition of 5%, 10%, 15%, or 20% brewers spent grain. SSF was performed for 6 days. A 95% confidence and prediction interval of the estimated regression line and expected interval are shown as dashed lines. The maximum bite force of fried hamburger, Quorn® product, and soy burger are also shown in the figure as dashed horizontal reference lines. The figure also presents the standard error in the estimated average bite force (95% confidence interval) as well as the expected output (bite force value) interval to receive at a specific % of BSG (95% prediction interval).
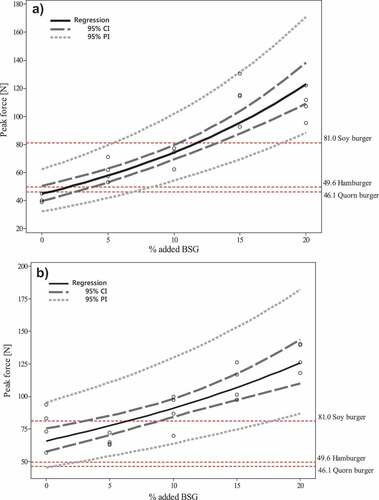
Table 2. Amino acid profile, total amino acids (TAA), total indispensable amino acids (TIAA), and indispensable amino acid ratio (IAA/AA) in stale sourdough bread based on dry weight referred as ‘before’fermentation begins, after 6 days solid state fermentation (whole fermentation period) by N. intermediareferred as ‘after’ and on BSG as a potential substrate. Indispensable amino acids in human are highlighted with gray.
Table 3. Fatty acids composition of stale sourdough bread based on dry weight before and after 6 days solid state fermentation by N. intermedia. Fatty acid (FA) composition, total FA, total saturated fatty acids (SFA), total monounsaturated fatty acids (MUFA), and total polyunsaturated fatty acids (PUFA) in stale sourdough bread based on dry weight referred as ‘before’ fermentation begins, after 6 days solid state fermentation (whole fermentation period) by N. intermedia referred as ‘after’ and on BSG as a potential substrate. Essential Fatty acids in human are highlighted with gray.
Figure 2. Percent nitrogen (n) based on dry weight of the fungal product after SSF on stale sourdough bread (filled column) or stale sourdough bread and 10% brewers spent grain (pattern columns) using N. intermedia (gray background) or R. oryzae (white background) after 0–10 days fermentation under light at 35°C, 90% Rh, and 40% initial moisture content. Results are expressed as the mean value ± one standard deviation.