Figures & data
Figure 1. Expression of miR-125b in EOC tissues and its relation with tumor stage. (a), Expression of miR-125b in EOC tissues and matched adjacent noncancerous tissues by qRT-PCR analysis (p < 0.0001). (b), Expression of miR-125b in different stages in EOC tissues by qRT-PCR analysis (p = 0.0029).
Figure 2. miR-125b decreases OC cell survival, proliferation and induces cell apoptosis in vitro. (a), qRT-PCR analysis showing different levels of miR-125b expression in the ovarian cancer cell lines SKOV3, A2780, SKOV3ip1, OVCAR 5 and CAOV3. (b), qRT-PCR analysis showing lower expression of miR-125b in CAOV3 cells after transfection with anti-miR-125b. (c), qRT-PCR analysis showing higher expression of miR-125b in SKOV3 cells after transfection with miR-125b. (d), CAOV3 cells transfected with anti-miR-125b had significantly increased survival by MTT assay, and SKOV3 cells transfected with miR-125b had significantly decreased survival by MTT assay. (D), CAOV3 cells transfected with anti-miR-125b increased the number of colonies, and SKOV3 cells transfected with miR-125b decreased the number of colonies; (e), SKOV3 cells transfected with miR-125b increased the number of apoptosis.*P < 0.05;**P < 0.01.
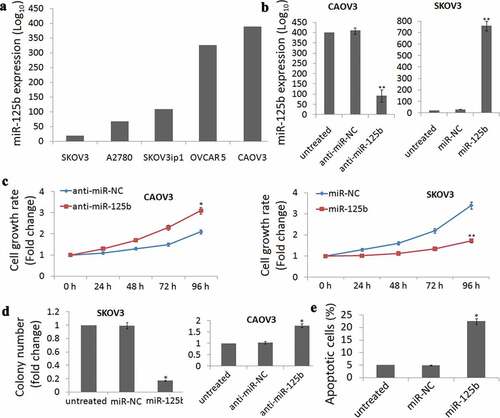
Figure 3. miR-125b overexpression decreases ovarian cancer cell invasion potential in vitro. (a), Representative photographs of invaded SKOV3 cells in different groups. (b), Representative photographs of invaded CAOV3 cells in different groups. *P< 0.05.
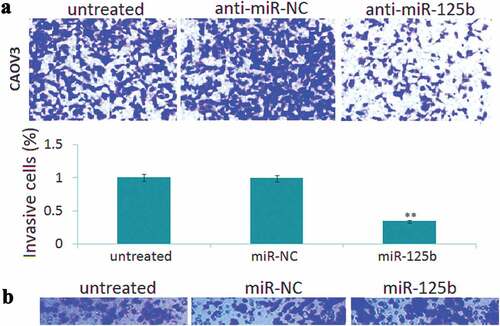
Figure 4. Effect of S100A4 on miR-125b-induced cell proliferation, apoptosis and cell invasion. (a), Western blot was used to detect S100A4 protein in CAOV3 cells transfected with anti-miR-125b or anti-NC, and SKOV3 cells transfected with miR-125b mimic or miR-NC. (b), Cell proliferation was detected by MTT in CAOV3/anti-miR-125b cells transfected with S100A4 siRNA on NC siRNA, or in SKOV3/miR-125b cells transfected with pEGFP-S100A4 or pEGFP; (c), Colony formation assay was used to detect cell growth in CAOV3/anti-miR-125b cells transfected with S100A4 siRNA on NC siRNA, or in SKOV3/miR-125b cells transfected with pEGFP-S100A4 or pEGFP. (d), Cell apoptosis was detected in SKOV3/miR-125b cells transfected with pEGFP-S100A4 or pEGFP using Flow cytometry analysis. E,Cell invasion was detect in CAOV3/anti-miR-125b cells transfected with S100A4 siRNA on NC siRNA, or in SKOV3/miR-125b cells transfected with pEGFP-S100A4 or pEGFP.*P< 0.05.
Figure 5. Effect of miR-125b on tumor growth and lung metastasis in vivo. (a), Volumes of all tumors were detected every 5 days; (b), Quantification d of macroscopic metastatic nodules on the lung surface. (c), miR-125b expression was detected in two groups by Qrt-PCR assay; (d), S100A4 protein expression was detected in two groups by Western blot assay. Vs miR-NC, ** P < 0.01.