
Figures & data
Table 1. Composition and nutrient levels of diets (DM basis)%
Table 2. Effect of compound bacteria treatment of buckwheat straw and alfalfa on growth performance of Tan sheep
Table 3. Number of OTUs and species in each group
Table 4. Alpha diversity detected by 16srDNA
Table 5. Abundance of dominant bacteria in the whole sample(%)
Figure 1. Principal coordinate analysis of OTUs of rumen bacteria
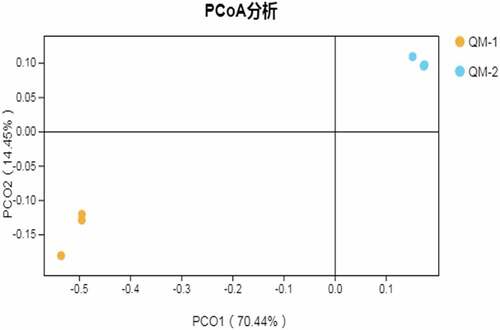
Figure 2. Difference between species via Welch’s t test
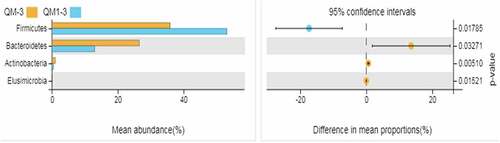
Figure 3. Differences among species via Welch’s t test
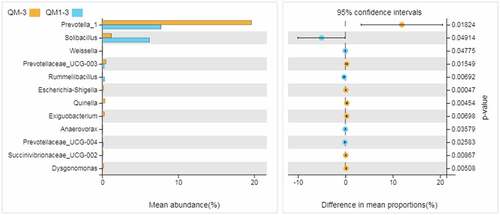
Table 6. Abundance of dominant bacteria in the whole sample(%)
Table 7. Ratio of high abundance families of reads to KEGG (level B)
Figure 4. KEGG annotation(level A)
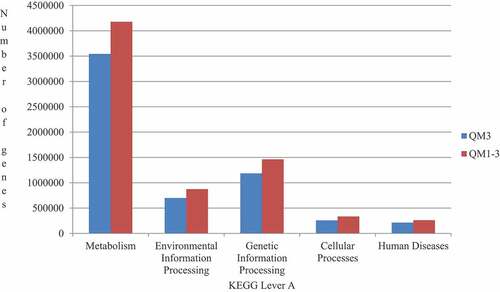
Figure 5. CAZy annotation(level A)
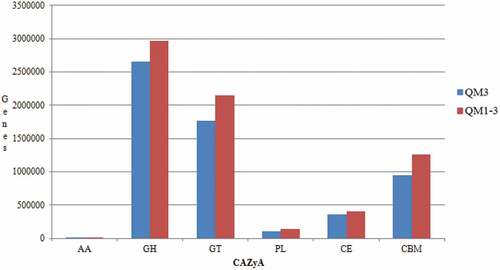
Figure 6. Analysis of CAZy abundance of Deseq2 between the control group and the experimental group
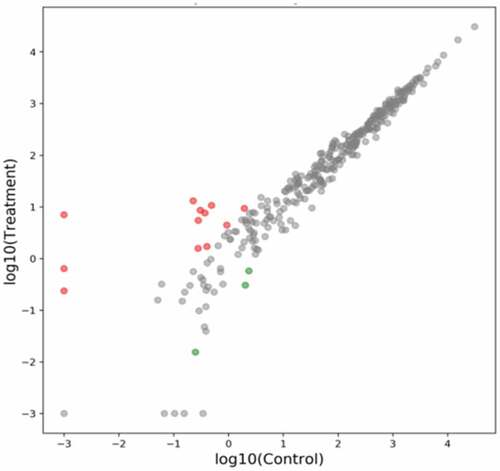
Table 8. Ratios of high abundance families of reads to CAZy (level B)
Table 9. Differences in CAZy abundance of DEseq2 between groups