
Figures & data
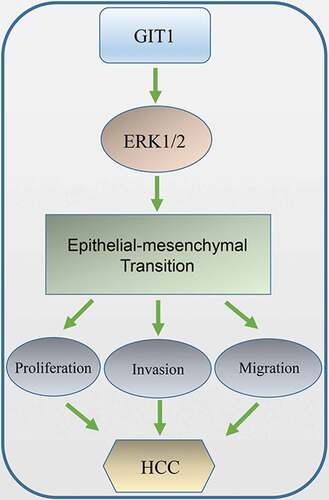
Figure 1. GIT1 expression in human cancers
(a–c) The mRNA level of GIT1 in gastric and liver cancers exceeded that of normal tissues based on oncomine database. According to the TCGA database, (d) the expression of GIT1 was different between HCC and normal liver tissues, and (e) was correlated significantly with the clinical stage. (f) Overall survival (OS) curve of HCC patients with high and low expression of GIT1.
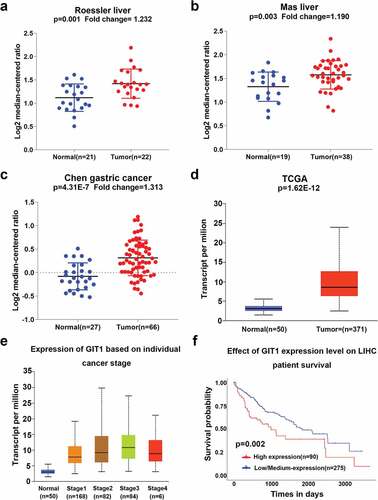
Figure 2. Expression pattern of GIT1 in HCC tissues
(a) GIT1 protein expression in randomly selected HCC tissues and matched adjacent tissues. GAPDH was used as the house-keeping gene. (b) The mRNA expression level of GIT1 in 28 pairs of HCC tissues and their matched peritumor tissues. GIT1 expression was normalized to that of GAPDH. (c) Immunohistochemical staining for GIT1 expression in randomly selected 54 pairs of HCC tissues from the TMA. (d) Representative images of HCC tissues and adjacent matched normal tissues (magnification: 40 ×, 200 ×). Scale bar: 50, 250 μm; **p < 0.01; ***p < 0.001.
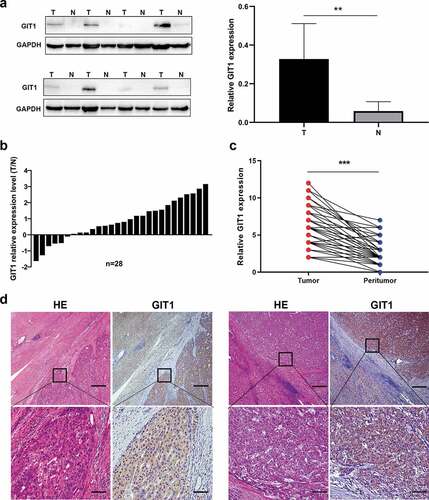
Figure 3. GIT1 overexpression promoted HCC cell invasion, proliferation, and migration
(a) Successful transfection of lentiviral vector into Huh7 and MHCC97-H cell lines as determined by western blot. GAPDH was used as an internal control. (b) CCK-8 and (c) colony-forming assays were used to assess the ability of cell proliferation. (d) Determination of the migratory ability of HCC cells by wound-healing assay. Scale bar = 100 μm. (e) Measurement of cell invasion ability by Transwell assay. Scale bar = 100 μm. **p < 0.01; ***p < 0.001.
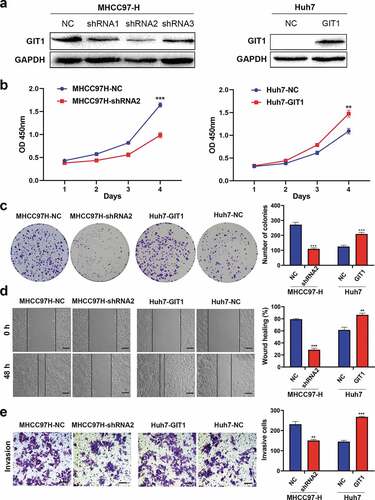
Figure 4. GIT1 promoted HCC tumorigenesis in vivo
(a, b) Representative pictures of tumors derived from nude mice implanted with the MHCC97H-NC, MHCC97H-shRNA2, Huh7-NC, and Huh7-GIT1 cell lines (n = 3). Tumor volume (c, d) and weight (e-f) revealed that GIT1 significantly promoted tumor growth. *p < 0.05.
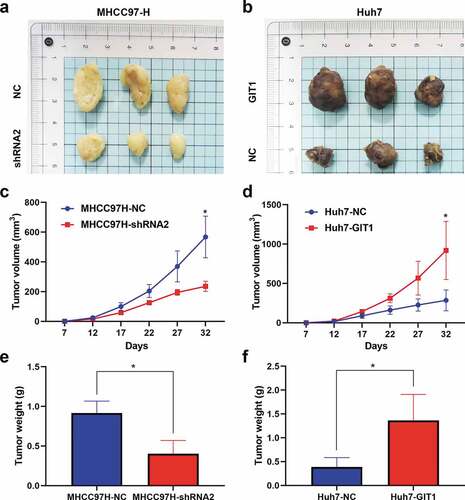
Figure 5. GIT1 promoted EMT in HCC cells through the ERK1/2
(a) Expression of Vimentin, β-catenin, and E-cadherin, in HCC cells with different GIT1 expression was determined using western blotting assays. (b) Protein levels of p-ERK1/2, ERK1/2, AKT, and p-AKT were analyzed by western blot. (c-d) SCH772984, the inhibitor of ERK1/2, inhibited ERK1/2 signaling and reversed the GIT1-induced EMT.Abbreviations: ERK1/2, extracellular regulated kinase 1/2; p-, phosphorylated.
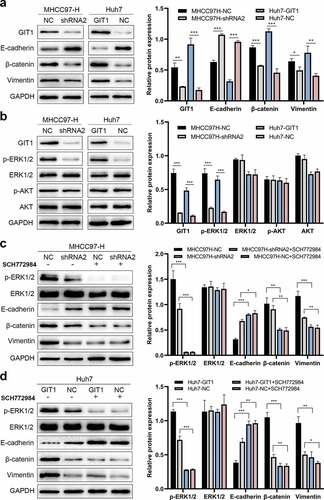
Figure 6. The expression of GIT1 and its prognosis value in 158 HCC patients
(a) Representative graphs of immunohistochemical and H&E staining for GIT1 in HCC samples: (+++) strong; (++) moderate; (+) low; (-) absence; Scale bar: 50, 250 μm. (b–c) Prognostic significance of GIT1 expression in patients with HCC are illustrated.Abbreviations: H&E, hematoxylin and eosin; OS, overall survival.
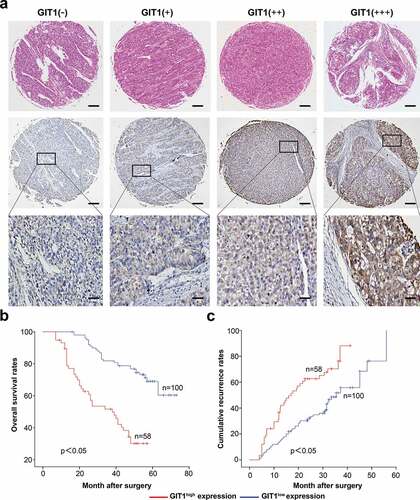
Table 1. Correlations between GIT1 with clinicopathologic features in 158 HCC patients
Table 2. Univariate and multivariate analyses of factors associated with recurrence and survival
Supplemental material