Figures & data
Figure 1. Types of lignin sugar complexes linkages
Table 1. Main instrument
Table 2. Different metal ion addition concentrations
Table 3. Different surfactant concentration
Table 4. Factors and levels of Plackett-Burman design
Figure 2. Effects of different factors on the yield of reducing sugar
Table 5. Plackett-Burman design test factors and response values
Table 6. ANOVA for selected factorial model Analysis of variance table
Table 7. Box-Benhnken test factors and their levels
Table 8. Box-Benhnken test factors and response values
Table 9. ANOVA for Response Surface Quadratic Model Analysis of variance table [Partial sum of squares – Type III]
Figure 3. Response surface of the effect of different factors on the conversion of reducing sugar
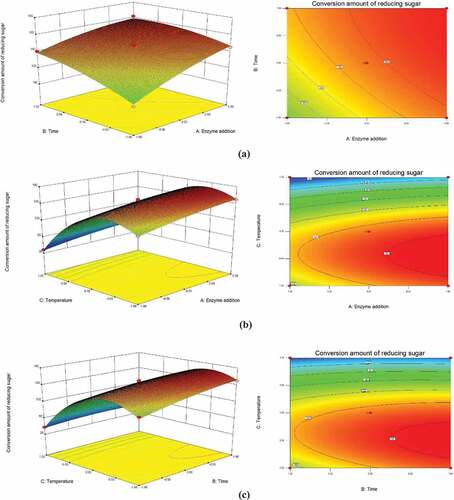
Figure 4. Comparison of reducing sugar production by different pretreatment methods
Figure 5. Effect of different metal ions on the conversion of reducing sugar
Figure 6. Effect of different surfactants on the conversion of reducing sugar
Figure 7. Effect of the mixture of metal ions and surfactants on reducing sugar
Table 10. Effect of Pretreatment on Poplar components (%)
Figure 8. Scanning electron microscope images of poplar with different pretreatment methods