Figures & data
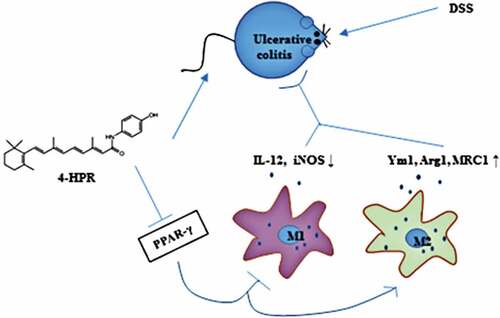
Table 1. Primers for RT- PCR
Figure 1. 4-HPR alleviated DSS-induced UC in mice. (a) DAI during experiment period. (b) Body weight change during experiment period. (c) Representative photos of colons and colon length (cm). (d) Representative images of colon tissues with H&E staining (× 200). Data are shown as mean ± SD. **p < 0.01, ***p < 0.001 vs. Control group; #p < 0.05, ##p < 0.01, ###p < 0.001 vs. UC group; &p < 0.05, &&p < 0.01, &&&p < 0.001 vs. UC+4-HPR-H group
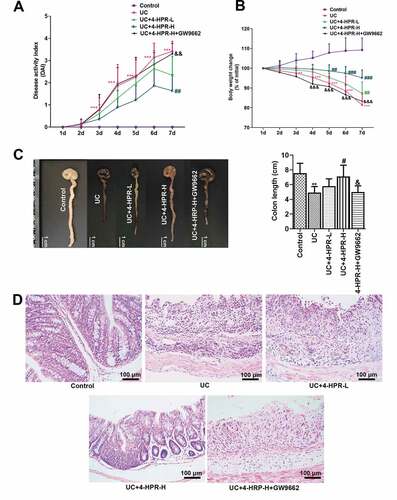
Figure 2. 4-HPR alleviated DSS-induced colonic inflammation in mice. (a) MPO activity. (b) PGE2 production. (c-e) Relative mRNA expression of IL-6, TNF-α and IL-1β. (f) The expression of COX-2 was examined by IHC at 400× magnification. Data are shown as mean ± SD. ***p < 0.001 vs. Control group; #p < 0.05, ##p < 0.01, ###p < 0.001 vs. UC group; &p < 0.05, &&p < 0.01, &&&p < 0.001 vs. UC+4-HPR-H group
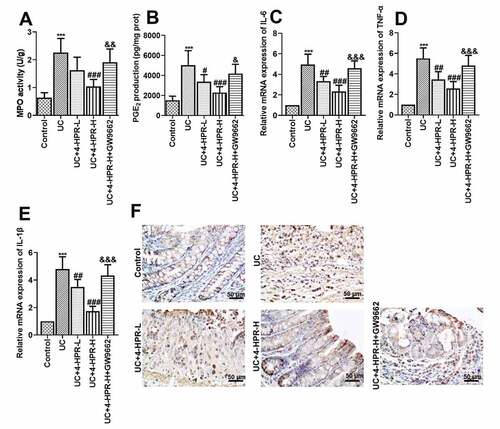
Figure 3. 4-HPR regulated macrophages polarization in colonic tissues of UC mice. (a-b) Relative mRNA expression of M1 markers. (c-e) Relative mRNA expression of M2 markers. Data are shown as mean ± SD. ***p < 0.001 vs. Control group; ##p < 0.01, ###p < 0.001 vs. UC group; &&p < 0.01, &&&p < 0.001 vs. UC+4-HPR-H group
Figure 4. 4-HPR activated PPAR-γ in colonic tissues from UC mice and LPS-induced RAW264.7 cells. (a) The nuclear protein expression levels of PPAR-γ in colonic tissues. (b) The nuclear protein expression levels of PPAR-γ in RAW264.7 cells. Data are shown as mean ± SD. ***p < 0.001 vs. Control group; ##p < 0.01, ###p < 0.001 vs. UC or LPS group; &&&p < 0.001 vs. UC+4-HPR-H group
Figure 5. 4-HPR alleviated inflammation and regulated macrophages polarization through activating PPAR-γ in LPS-induced RAW264.7 cells. (a-c) Relative mRNA expression of pro-inflammatory cytokines. (d-e) Relative mRNA expression of M1 markers. (f-h) Relative mRNA expression of M2 markers. (i) CD86 (M1 maker)-labeled macrophages were determined by flow cytometry assay. (j) CD206 (M2 maker)-labeled macrophages were determined by flow cytometry assay. Data are shown as mean ± SD. ***p < 0.001 vs. Control group; #p < 0.05, ##p < 0.01, ###p < 0.001 vs. LPS group; &p < 0.05, &&p < 0.01, &&&p < 0.001 vs. LPS+4-HPR-H group