
Figures & data
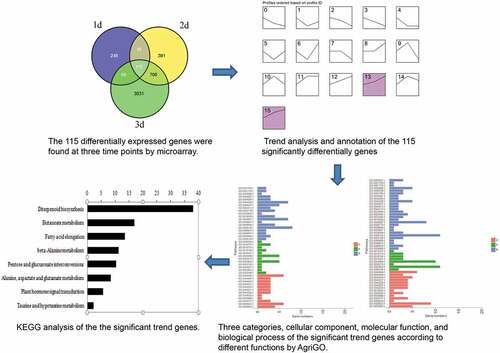
Table 1. Genes chosen for confirmation by qRT-PCR
Figure 1. The expression level of the genes chosen for confirmation by QRT-PCR at three time points
Figure 2. Trend analysis and annotation of the 115 significantly differentially expressed genes. (a) Using stem software to cluster the change trend of the 115 genes during the three time points. Marked color chart is a significant trend, such as the thirteenth and fifteenth diagram. (b) Three categories of the significant trend genes according to different functions by AgriGO database. C, F and P corresponding to cellular component, molecular function, and biological process, respectively. (c) KEGG analysis of the significant trend genes
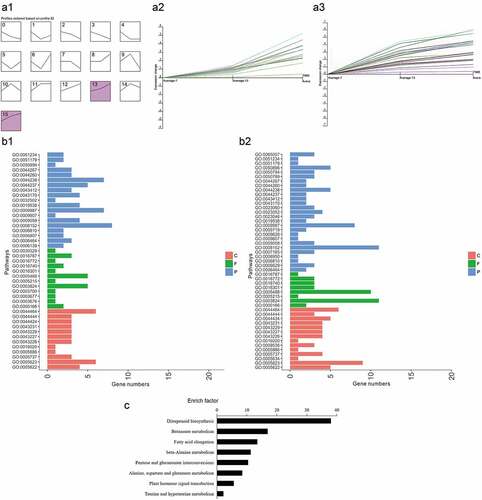
Table 2. The expression of rice defense-related genes
Table 3. The expression of rice novel defense-related genes