Figures & data
Figure 1. Time-dependent ROC curve for the IRGPI in the cohort. An IRGPI score of 0.963 was used as the cutoff for the IRGPI to stratify pancreatic cancer sufferers into low- and high-risk groups
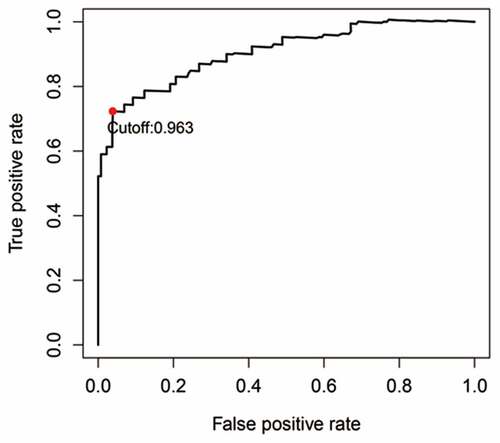
Figure 2. Kaplan-Meier curves for the overall survival (OS) of different IRGPI-defined risk groups. The OS of the high-risk group was significantly shorter than that of the low-risk group (p < 0.001)
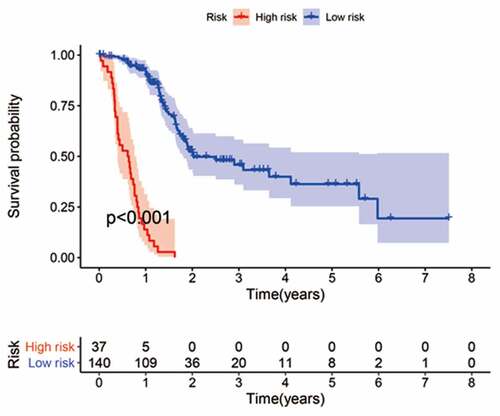
Figure 3. Univariate and multivariate analyses of prognostic factors. Clinical features such as age, sex, grade, stage, depth of tumor invasion (t) and lymph node metastasis (n) had no prognostic value in either the univariate or multivariate Cox analysis. Only the IRGPI signature remained an independent prognostic factor in the univariate and multivariate Cox analyses
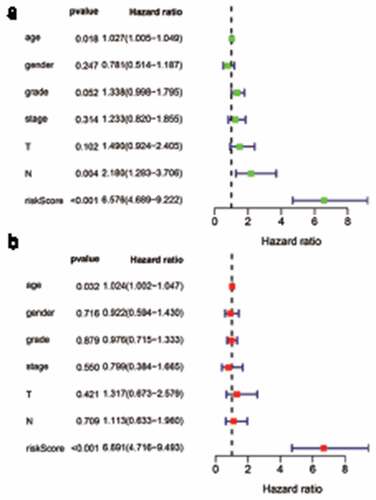
Figure 4. Immune infiltration statuses within IRGPI-defined risk groups. Summary of the abundances of 22 immune cell types estimated by CIBERSORT for different risk groups. (a–f) show that M1 macrophages and resting NK cells were significantly enriched in the high-risk group (M1 macrophages: p = 7.234e-4; resting NK cells: p = 0.008). The percentages of naïve B cells, resting dendritic cells, CD8 T cells and regulatory T cells (Tregs) were significantly higher in the low-risk group (naïve B cells: p = 7.194e-05; resting dendritic cells: p = 0.031; CD8 T cells: p = 0.027; Tregs: p = 0.003). A comparative summary of the CIBERSORT outputs for the high-risk group and low-risk group is shown in G
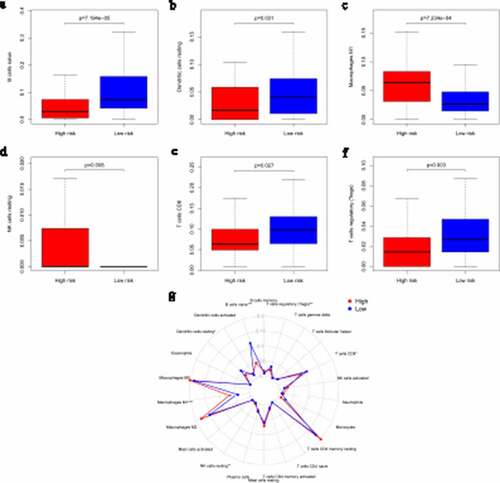
Figure 5. Immunohistochemical detection of immune cells. M1 macrophage levels were significantly higher in the high-risk group, while Treg levels were significantly higher in the low-risk group
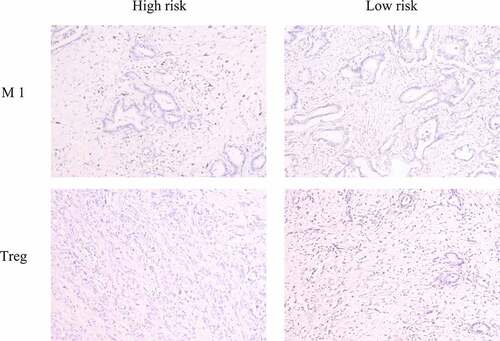
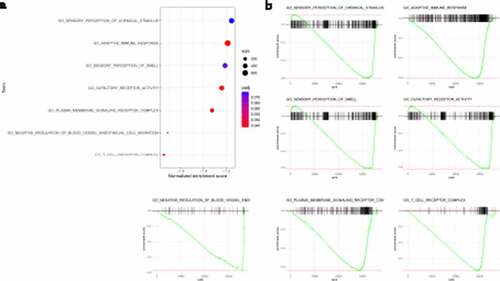
Figure 6. Immune-related signature gene analysis. Gene ontology (GO) analysis of the immune signature genes. GO analysis confirmed that the IRGPI signature genes in the cohort were mostly party to sensory perception of a chemical stimulus and the adaptive immune response