
Figures & data
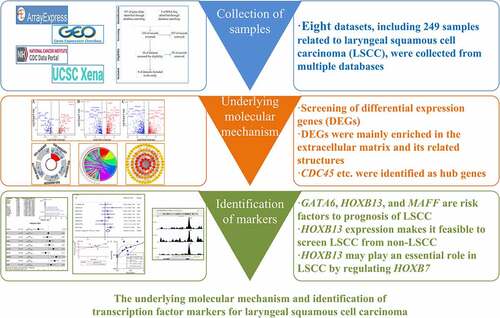
Figure 1. Flow chart of this study. LSCC: laryngeal squamous cell carcinoma; GO: Gene Ontology; KEGG: Kyoto Encyclopedia of Genes and Genomes; PPI: protein-protein interaction; DEGs: differential expression genes; TF: transcription factor; ChIP-Seq, chromatin immunoprecipitation sequencing
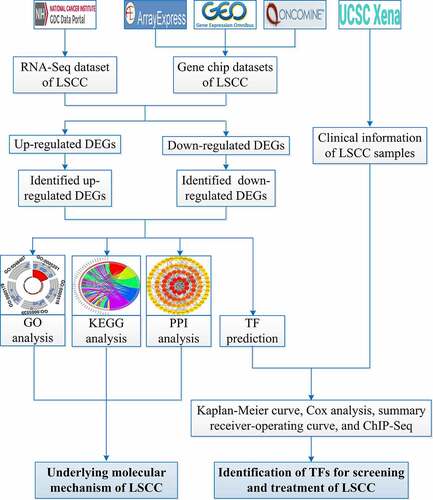
Figure 2. Screening processes for datasets included in the study
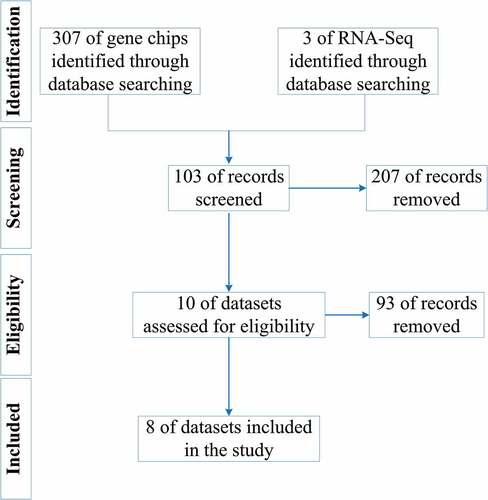
Table 1. Basic information of each dataset
Figure 3. Volcano plots of differential expression genes in E-MEXP-44 (a), GSE29330 (b), GSE51985 (c), GSE58911 (d), GSE59102 (e), GSE84957 (f), GSE107591 (g) and TCGA (h). Up: up-regulated genes; Down: down-regulated genes
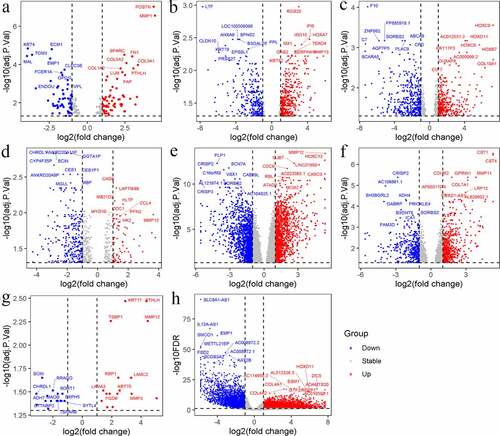
Figure 4. Gene Ontology (GO) analysis for identified up-regulated differential expression genes. Cellular components (a), biological processes (b) and molecular functions (c) of identified up-regulated differential expression genes. The blue nodes in the concentric circles represent genes clustered in specific GO terms. The larger size and darker color of the internal departments represent the more significant enrichment of GO term
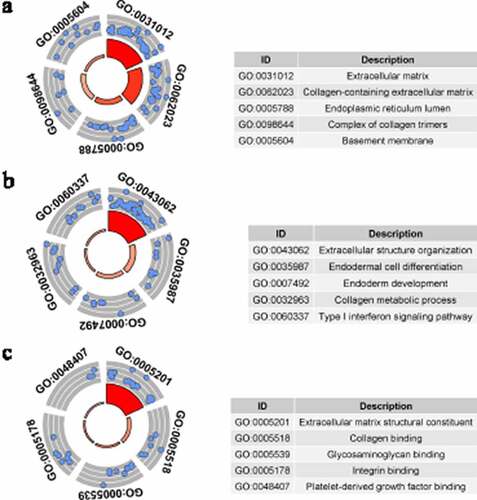
Figure 5. Gene Ontology (GO) analysis for identified down-regulated differential expression genes. Cellular components (a), biological processes (b) and molecular functions (c) of identified down-regulated differential expression genes. The blue nodes in the concentric circles represent genes clustered in specific GO terms. The larger size and darker color of the internal departments represent the more significant enrichment of GO term
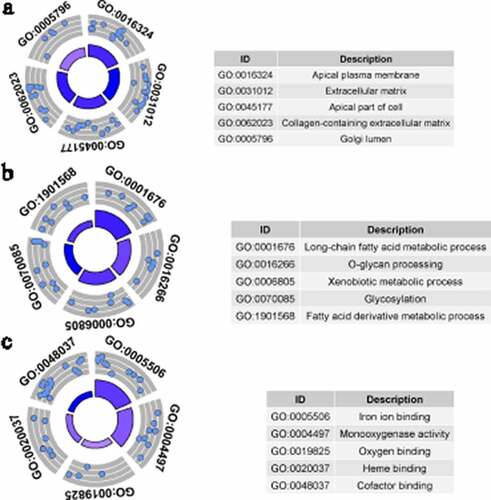
Figure 6. Kyoto Encyclopedia of Genes and Genomes (KEGG) analysis of identified up-regulated differential expression genes (a) and identified down-regulated differential expression genes (b). Different color bands correspond to different KEGG enrichment pathways
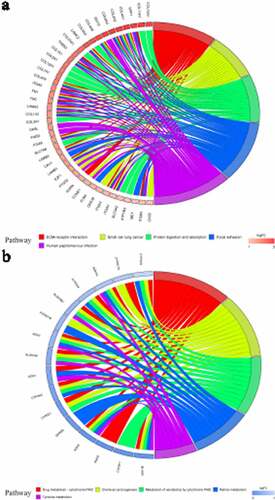
Figure 7. Protein-protein interaction (PPI) analysis for identified up-regulated differential expression genes (a) and identified down-regulated differential expression genes (b)
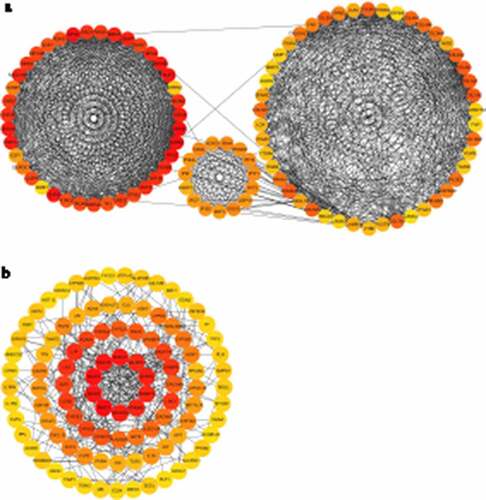
Figure 8. Kaplan-Meier curves of transcription factors related to laryngeal squamous cell carcinoma prognosis. CHD4 (a); BCAT1 (b); FOXA2 (c); GATA6 (d); HNF1A (e); HOXB13 (f); MAFF (g); TCF4 (h)
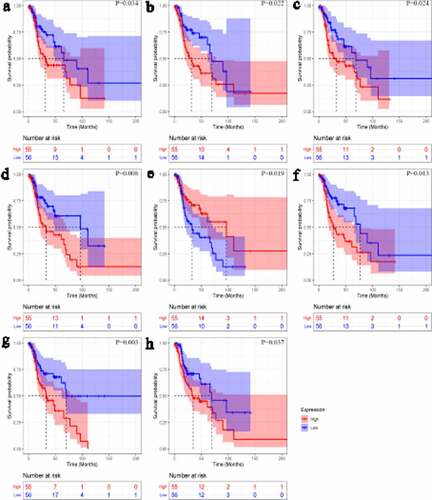
Figure 9. Forest plots for identifying transcription factors independently related to LSCC prognosis. A: univariate Cox analysis; B: multivariate Cox analysis. N: number of samples; * p < 0.05; ** p < 0.005; *** p < 0.001
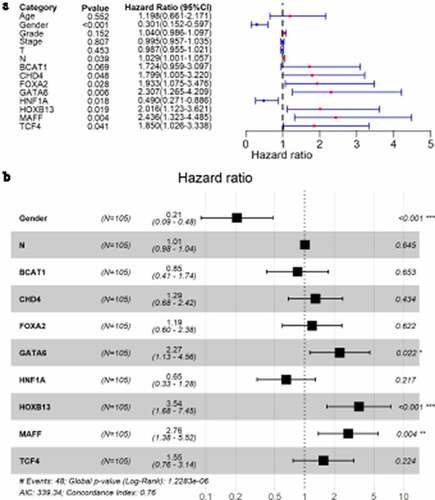
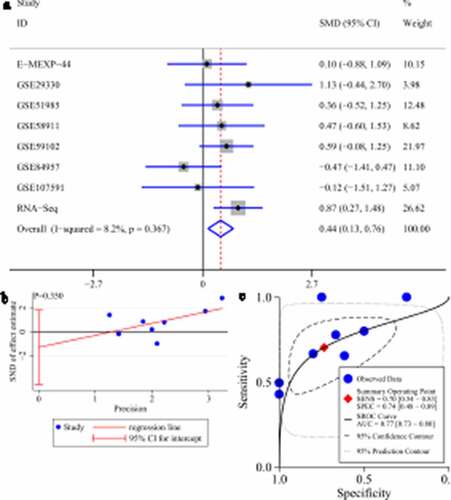
Figure 10. Expression of HOXB13 and its screening effect in laryngeal squamous cell carcinoma (LSCC). A: forest plot with standard mean difference (SMD) for evaluating deferential expression of HOXB13 between LSCC tissues and non-LSCC tissues. B: funnel plot with Egger’s test; C: summary receiver-operating curve
Data availability statement
All datasets used in the research can be found in ArrayExpress (https://www.ebi.ac.uk/arrayexpress/, containing the dataset of E-MEXP-44), Gene Expression Omnibus (https://www.ncbi.nlm.nih.gov/geo/, containing datasets of GSE29330, GSE51985, GSE58911, GSE59102, GSE84957, GSE107591), and the Genomic Data Download from Commons Data Portal (https://portal.gdc.cancer.gov/repository, containing an RNA-Seq dataset related to laryngeal squamous cell carcinoma) databases.