Figures & data
Figure 1. LncRNA HCP5 silencing inhibits the proliferation of AGS cells. (a) The expression level of HCP5 in GC tumor samples and normal samples predicted by GEPIA website. (b,c) The expression of HCP5 was detected by RT-qPCR. (d) The survival rate of cells was evaluated with cell viability assay. (e) The cell proliferation was assessed by colony formation assay, and quantification (f). Error bars represent the mean ± SEM from three independent experiments. **P< 0.01, ***P< 0.001 vs. Control
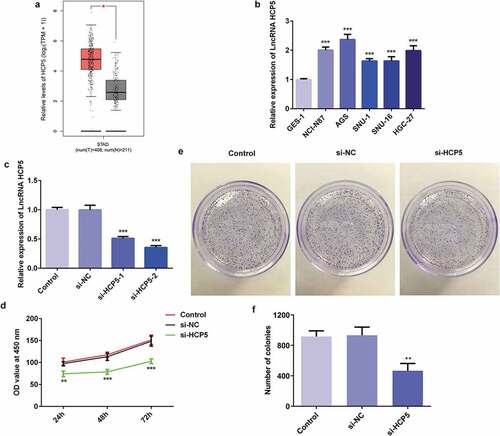
Figure 2. LncRNA HCP5 silencing inhibits the migratory and invasive abilities of AGS cells. (a,b) The cell migration was analyzed by wound-healing assay. Scale bars = 100 μm. (c,d) The cell invasion was determined using transwell assay. Scale bars = 100 μm. (e) The expression levels of MMP3 and MMP9 were determined by western blot. Error bars represent the mean ± SEM from three independent experiments. ***P< 0.001 vs. Control
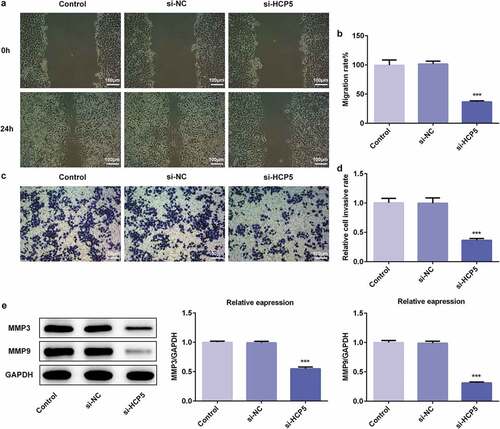
Figure 3. LncRNA HCP5 silencing promotes the apoptosis of AGS cells. (a,b) The cell apoptosis rate was determined by flow cytometry. (c,d) The expression levels of Bcl-2, Bax, Caspase-3 and pro-Caspase-3 were determined by western blot, the GAPDH was set as the internal normalization control. Error bars represent the mean ± SEM from three independent experiments. ***P< 0.001 vs. Control
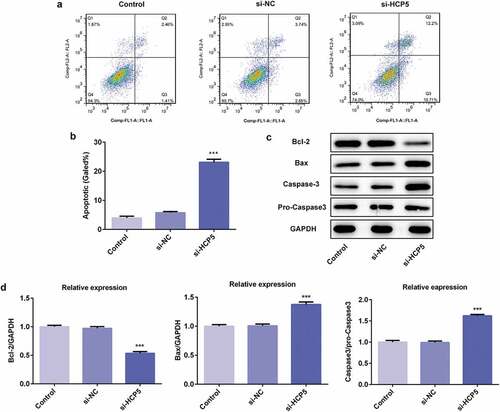
Figure 4. LncRNA HCP5 silencing leads to increase in miR-299-3p expression. (a,b) The relative expression of miR-299-3p was detected by RT-qPCR. (c) 3ʹ-UTR regions of HCP5 is partially complementary to miR-299-3p. (d) The relative luciferase activities in AGS cells transfected with wild-type (WT) or mutated (MUT) HCP5 reporter plasmids and miR-299-3p mimics or vector. Error bars represent the mean ± SEM from three independent experiments. **P< 0.01, ***P< 0.001 vs. Control
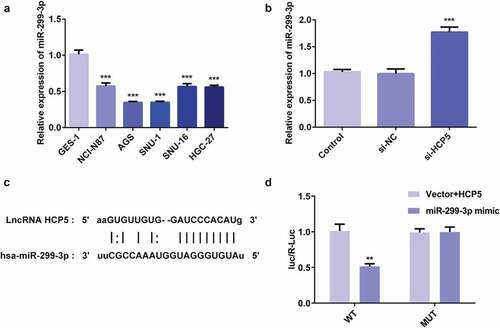
Figure 5. LncRNA HCP5 silencing inhibits proliferation, invasion and migration via upregulation of miR-299-3p in AGS cells. (a) The relative expression of miR-299-3p was detected by RT-qPCR. (b) The relative mRNA level of HCP5 was analyzed by RT-qPCR. (c) The survival rate of cells transfected with or without si-HCP5 and miR-299-3p inhibitor was evaluated with cell viability assay. (d) The cell proliferation was assessed by colony formation assay, and quantification (e). (f,g) The cell migration was analyzed by wound-healing assay. Scale bars = 100 μm. (h,i) The cell invasion was determined using transwell assay. Scale bars = 100 μm. (j) The expression levels of MMP3 and MMP9 were analyzed by western blot. Error bars represent the mean ± SEM from three independent experiments. **P< 0.01, ***P< 0.001 vs. Control; #P< 0.05, ###P< 0.001 vs. si-HCP5
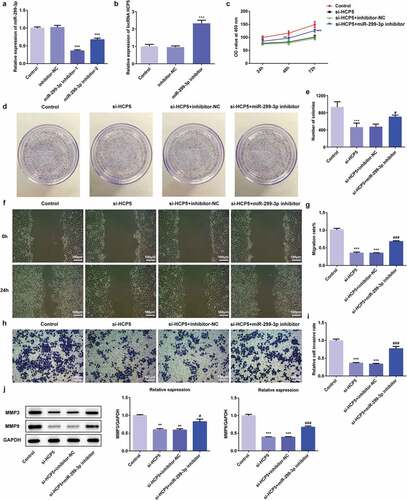
Figure 6. LncRNA HCP5 silencing promotes apoptosis via upregulation of miR-299-3p in AGS cells. (a,b) The cell apoptosis rate was determined by flow cytometry. (c) The expression levels of Bcl-2, Bax, Caspase-3 and pro-Caspase-3 were determined by western blot, the GAPDH was set as the internal normalization control. Error bars represent the mean ± SEM from three independent experiments. ***P< 0.001 vs. Control; ##P< 0.01, ###P< 0.001 vs. si-HCP5
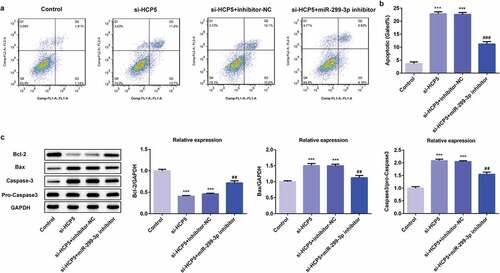
Figure 7. SMAD5 expression is increased both in vivo and vitro and regulated by miR-299-3p. (a) The expression level of SMAD5 in GC tumor samples and normal samples predicted by GEPIA website. (b) The overall survival in STAD patients predicted by GEPIA websites. (c) The proteins expression of SMAD5 was determined by western blot. (d) The mRNA level of SMAD5 was quantified by RT-qPCR. (e) The binding site of has-miR-299-3p on SMAD5. (f) The interaction of SMAD5 with miR-299-3p was confirmed by luciferase reporter assay. (g) The proteins expression of SMAD5 were determined by western blot. (h) The mRNA level of SMAD5 were quantified by RT-qPCR. Error bars represent the mean ± SEM from three independent experiments. **P< 0.01, ***P< 0.001 vs. Control; ##P< 0.01, ###P< 0.001 vs. si-HCP5
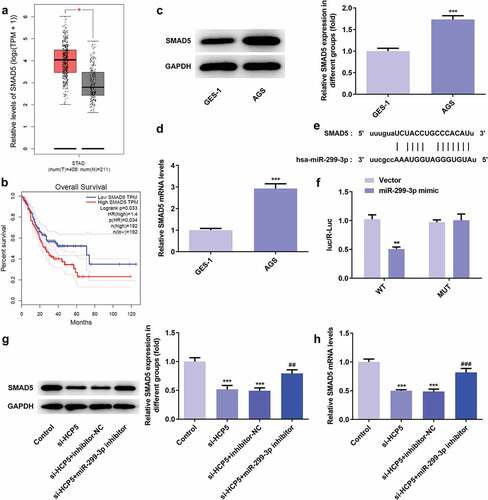
Figure 8. SMAD5 silencing inhibited AGS cell proliferation. (a) The proteins expression of SMAD5 was determined by western blot. (b) The mRNA level of SMAD5 was quantified by RT-qPCR. (c) The viability of AGS cells transfected with or without si-SMAD5 was evaluated with cell viability assay. (d) The cell proliferation was assessed by colony formation assay, and quantification (e). Error bars represent the mean ± SEM from three independent experiments. ***P< 0.001 vs. Control
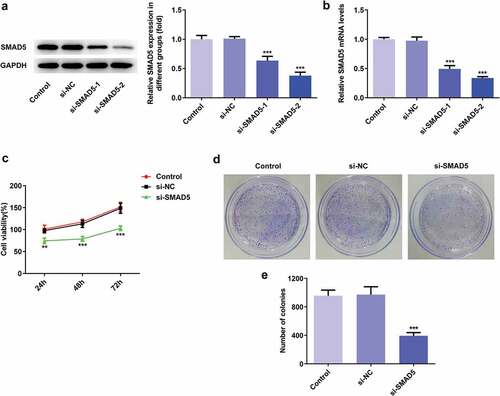
Figure 9. SMAD5 silencing inhibited AGS cells invasion and migration. (a) The cell migration was analyzed by wound-healing assay. Scale bars = 100 μm. (b) The cell invasion was determined by transwell assay. Scale bars = 100 μm. (c) The expression levels of MMP3 and MMP9 were analyzed by western blot. Error bars represent the mean ± SEM from three independent experiments. **P< 0.01, ***P< 0.001 vs. Control
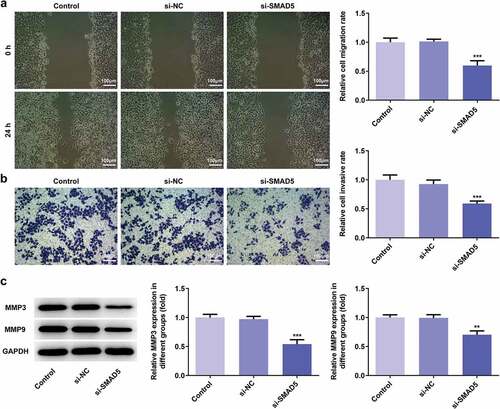
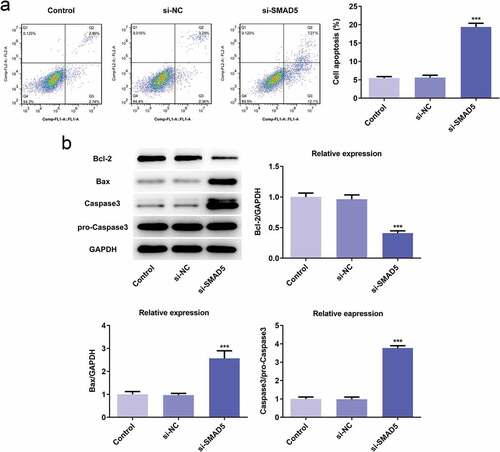
Figure 10. SMAD5 silencing promoted AGS cells apoptosis. (a) The cell apoptosis rate was determined by flow cytometry. (b) The expression levels of Bcl-2, Bax, Caspase-3 and pro-Caspase-3 were determined by western blot, the GAPDH was set as the internal normalization control. Error bars represent the mean ± SEM from three independent experiments. ***P< 0.001 vs. Control