
Figures & data
Figure 1. Differentially expressed immune-related genes (IRGs). (a) Heat map. (b) Expression patterns of 29 immune-related genes (IRGs) in nonmetastatic and metastatic osteosarcoma samples. The red dots on the X-axis indicates the metastatic samples and the blue dots indicate the nonmetastatic samples. N, nonmetastatic samples; T, metastatic samples
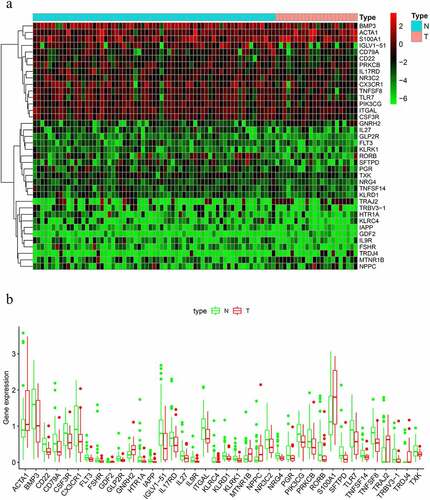
Figure 2. Results of gene functional enrichment. (a) GO analysis shows the biological processes and molecular functions involved in DIRGs. (b) KEGG pathway analysis of differentially immune-related genes
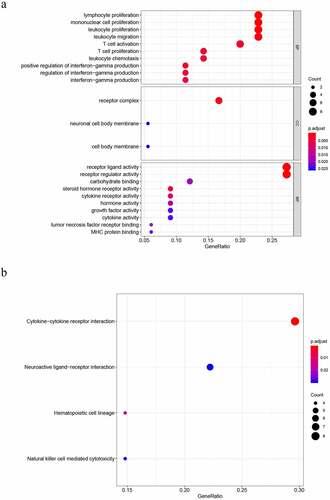
Table 1. The specific information of IRGs
Figure 3. Prognostic value and mutations of IRGs. (a) Forest plot of immune genes related to OS survival. (b) Mutations in prognosis-related IRGs
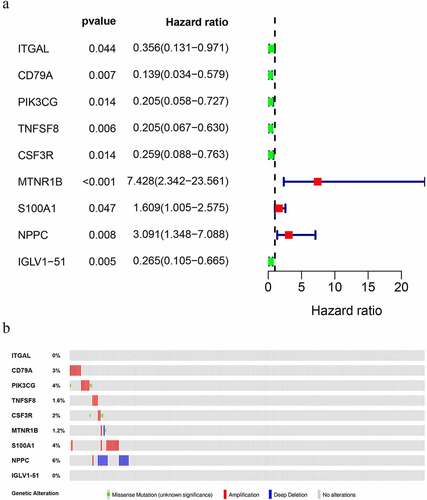
Figure 4. Immune-related prognostic index (PI) of OS patients. (a) Patient overall survival was notably lower in the high-risk group. (b) The heatmap of the four signature genes expression profiles. (c-d) The distribution of risk scores, patient survival time, and status for OS. (e-f) Univariate and multiple regression analysis of OS and the relationships between risk score, sex, metastasis, and age
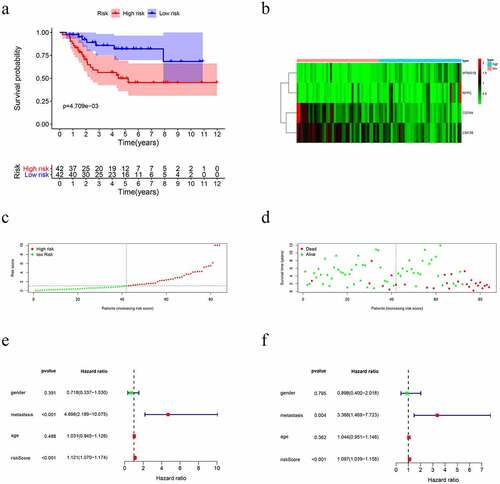
Figure 5. The prognostic value of immune-related prognostic index of OS patients. (a) Survival-dependent receiver operating characteristic (ROC) curves for validation of prognostic value of the prognostic index. (b) The nomogram for predicting overall survival
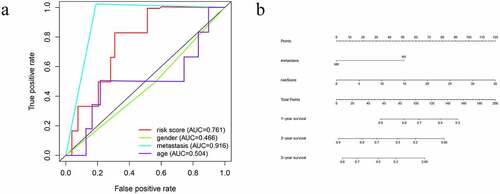
Table 2. Immune-related gene sets that associated with high-risk group
Figure 6. Enrichment plots of gene ontology annotation between high- and low-risk groups
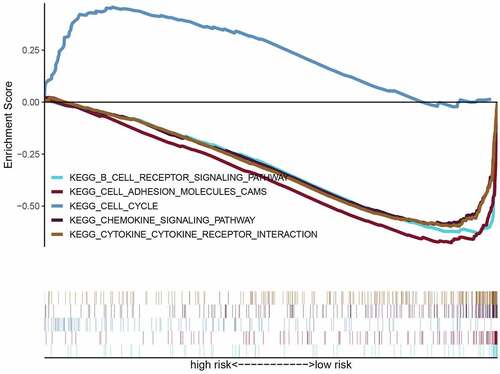
Figure 7. Evaluation of the proportions of TIICs based on CIBERSORT. (a) The varied proportions of 22 subtypes of immune cells in tumor samples from the high- and low-risk groups. (b) Heatmap of 22 immune-infiltrating cell types in tumor samples
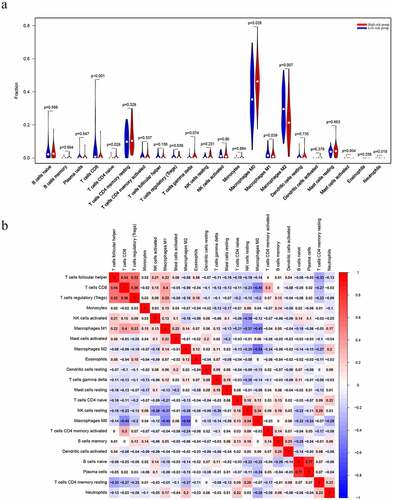
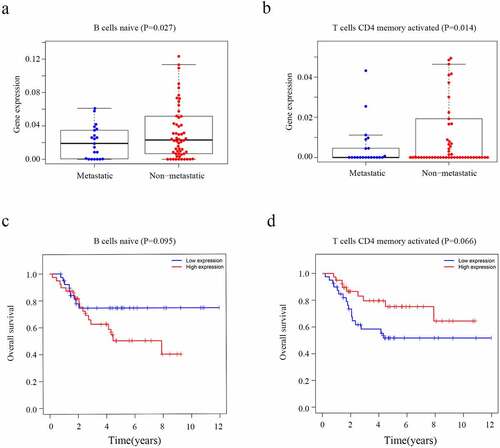
Figure 8. The level of immune cells and Kaplan-Meier analysis in patients with OS. (a) Relationship between the level of CD4 naïve T cells and metastasis. (b) Relationship between the level of T cells CD4 memory activated cells and metastasis. (c) The association between CD4 naïve T cells and overall survival of OS. (d) The association between T cells CD4 memory activated and overall survival of OS
Supplemental Material
Download ()Availability of data and materials
All analyzed data are included in this published article and its supplementary information file. The original data are available upon reasonable request to the corresponding author.