
Figures & data
Table 1. Characteristics of patients with gastric cancer in GSE84437 dataset
Figure 1. Expression level of COL10A1 in GC and its relationship with pathological parameters. The mRNA expression of COL10A1 in GC (a), diffuse gastric adenocarcinoma (b) and gastric intestinal-type adenocarcinoma (c, d) compared to normal individuals derived from the Oncomine database. Comparison of COL10A1 expression between GC tissues and adjacent nontumor tissue base on TCGA data (e). The expression of COL10A1 is grouped by tumor differentiation (f), pathological stage (g) and T stage (h)
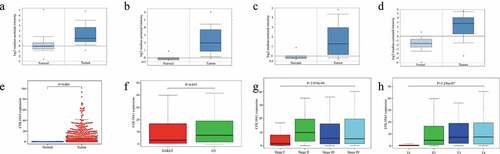
Table 2. Relationship between COL10A1 expression and clinicopathological parameters in gastric cancer
Table 3. COL10A1 expression correlated with clinicopathological parameters
Figure 2. Survival analysis, univariate and multivariate analysis. Kaplan-Meier curve of the relationship between COL10A1 mRNA expression and the prognosis of GC patients based on Kaplan-Meier plots database (a) and GSE84437 dataset (d). Univariate and multivariate analysis of COL10A1 expression and its correlation in patients with GC base on TCGA data (b, c) and GSE84437 dataset (e, f)
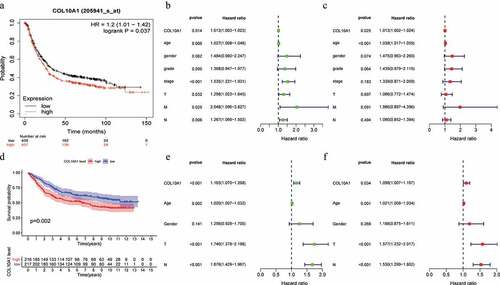
Table 4. Correlation of COL10A1 mRNA expression and clinical prognosis in gastric cancer
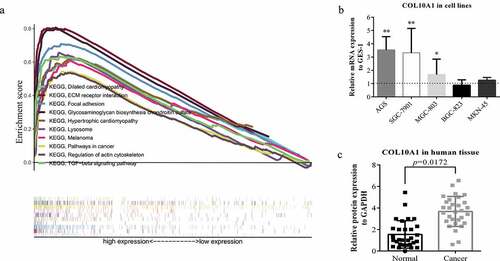
Figure 3. GSEA analysis and experimental verification. (a) A combined enrichment plot has been obtained from the analysis of the enrichment of the gene series, including the enrichment fraction and gene series (top 10 terms). (b) The expression level of COL10A1 was higher than that of GES-1 in three kinds of GC cells (AGS, SGC-7901 and MGC-803) (*P < 0.05, **P < 0.01). (c) qRT-PCR analysis of COL10A1 mRNA expression in 30 pairs of GC tissues and adjacent nontumor tissues
Supplemental Material
Download ()Availability of data and materials
Data were analyzed from GEO (http://www.ncbi.nlm.nih.gov/geo), TCGA (https://portal.gdc.cancer.gov), Oncomine database (https://www.oncomine.org/resource/login.html) and Kaplan–Meier plots (https://kmplot.com/analysis/). We declare that the data and materials in this study will be provided free of charge to scientists for noncommercial purposes.