
Figures & data
Figure 1.. Identification of genes that act as prognostic factors for HCC
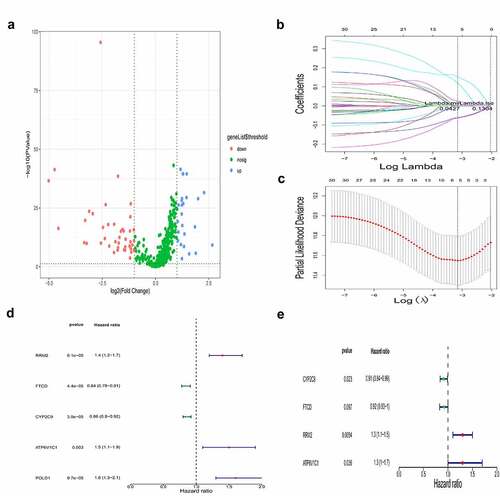
Figure 2. Construction of the prognostic model
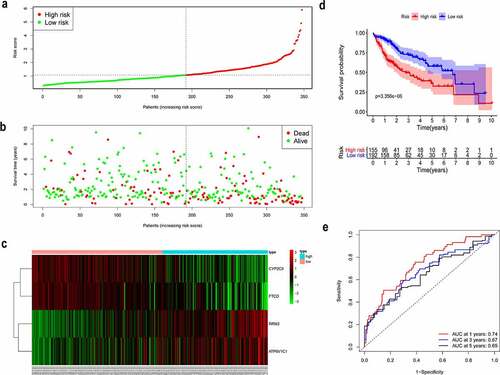
Table 1. Multivariate Cox regression analysis of the gene signature in HCC patients
Figure 3. Validation of the gene signature in a patient cohort from the ICGC
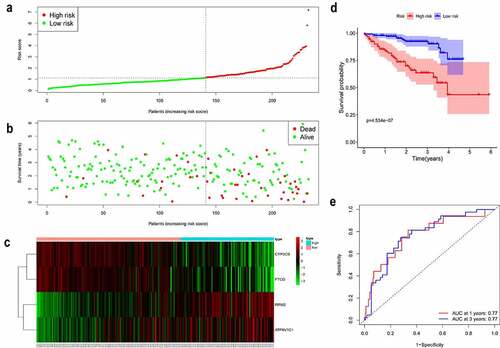
Figure 4. Co-expression network of the four iron metabolism-related and methylated genes
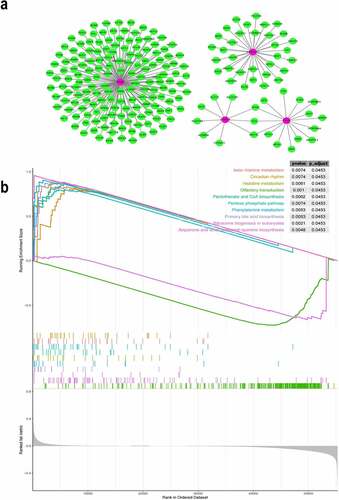
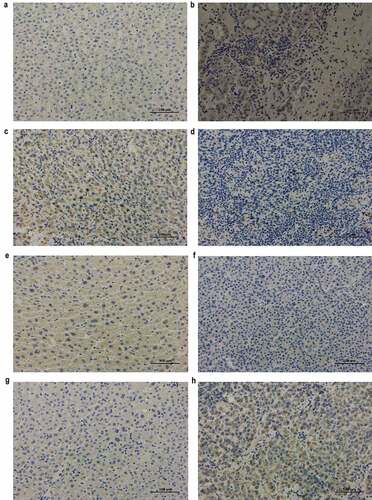
Figure 5. Immunohistochemical analysis of RRM2, FTCD, CYP2C9, and ATP6V1C1 in adjacent non-cancerous and cancerous tissues from HCC patients (original magnification, ×200)
Supplemental Material
Download ()Data availability statement
The data that support the findings of the study are available in The Cancer Genome Atlas (https://cancergenome.nih.gov/), the Molecular Signatures Database (https://www.gsea-msigdb.org/gsea/msigdb), and the International Cancer Genome Consortium (https://dcc.icgc.org/).