Figures & data
Table 1. The means and standard deviations of miRNA-222-3p expression levels in LPCa and MPCa based on six studies
Figure 1. TCGA: The Cancer Genome Atlas; LPCa: localized prostate cancer; MPCa: metastatic prostate cancer
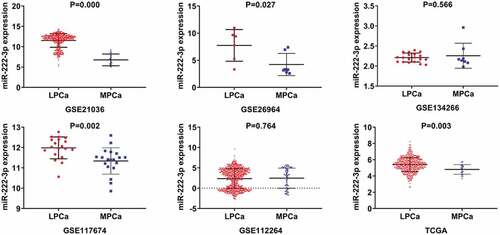
Figure 2. The ROC curves of miRNA-222-3p for distinguishing capacity in MPCa samples. area under the curve: area under the curve; TCGA: The Cancer Genome Atlas; ROC: receiving operator characteristic; MPCa: metastatic prostate cancer
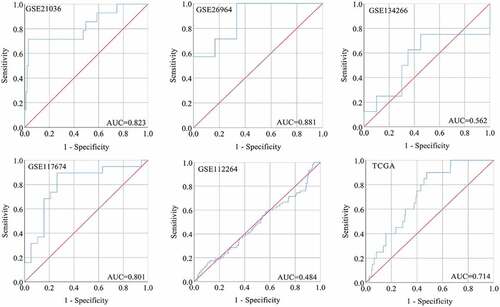
Figure 3. The expression and distinguishing capacity of miRNA-222-3p in MPCa. (a) Forest plot. (b) Sensitivity analysis plot. (c) The Begg’s funnel plot of the publication bias. (d) Egger’s publication bias plot. (e)SROC curve. (f) Deek’s funnel plot test. TCGA: The Cancer Genome Atlas; standard mean difference: standard mean difference; CI: confidence interval; area under the curve: area under the curve; SROC: summarized receiver operating characteristic; MPCa: metastatic prostate cancer
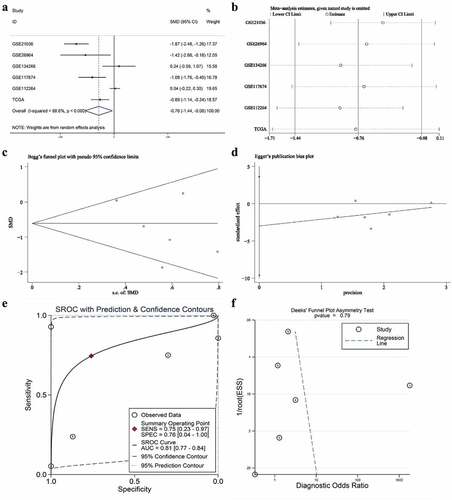
Figure 4. Kaplan-Meier analysis of miRNA-222-3p and the GO and KEGG pathway analyses of target genes in MPCa. (a) Overall survival of patients with different miRNA-222-3p expression in PCa. (b) Metastasis-free survival rate of patients with different miRNA-222-3p expression in PCa. (c)The Venn diagrams of potential target genes of miRNA-222-3p. (d) Biological process (BP). (e) Cellular component (CC). (f) Molecular function (MF). (g) KEGG pathway analysis. DEGs: differently expressed genes; PCa: prostate cancer; GO: Gene Ontology; KEGG: Kyoto Encyclopedia of Genes and Genomes; MPCa: metastatic prostate cancer
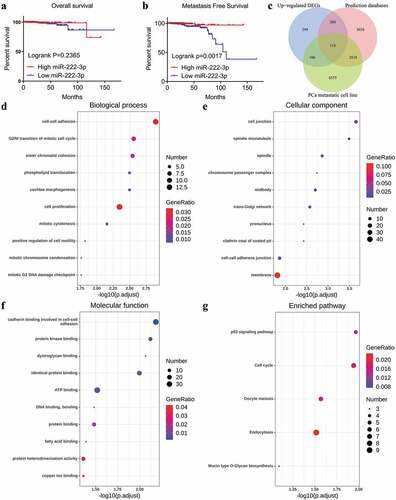
Figure 5. The association between miRNA-222-3p and SNAP91. (a) The binding sequence between SNAP91 and miRNA-222-3p. (b) Spearman’s correlation analysis between miRNA-222-3p and SNAP91 in MPCa. (c) Spearman’s correlation analysis between miRNA-222-3p and SNAP91 in PCa. SNAP91: synaptosome-associated protein 91; MPCa: metastatic prostate cancer; PCa: prostate cancer
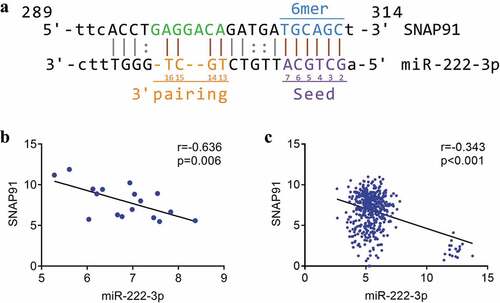
Table 2. The means and standard deviations of SNAP91 expression levels in LPCa and MPCa based on nine studies
Figure 6. The expression and distinguishing capacity of SNAP91 in MPCa. (a) Forest plot. (b) Sensitivity analysis plot. (c) The Begg’s funnel plot of the publication bias. (d) Egger’s publication bias plot. (e)SROC curve. (f) Deek’s funnel plot test. TCGA: The Cancer Genome Atlas; standard mean difference: standard mean difference; CI: confidence interval; area under the curve: area under the curve; SROC: summarized receiver operating characteristic; SNAP91: synaptosome-associated protein 91; MPCa: metastatic prostate cancer
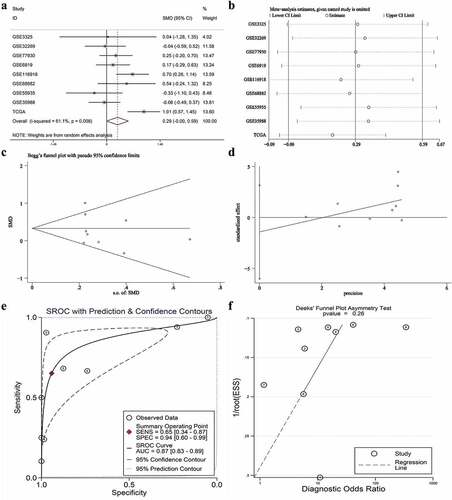
Figure 7. Expression levels of SNAP91 between LPCa samples and MPCa samples. TCGA: The Cancer Genome Atlas; SNAP91: synaptosome-associated protein 91; LPCa: localized prostate cancer; MPCa: metastatic prostate cancer
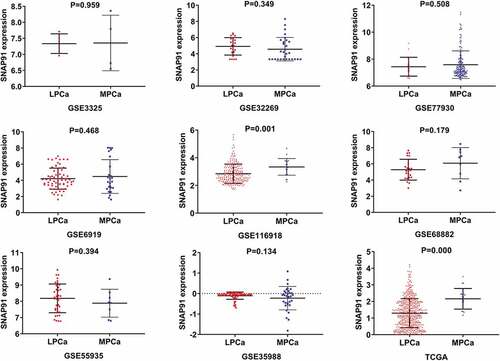
Figure 8. The ROC curves of SNAP91 for distinguishing capacity in MPCa samples. area under the curve: area under the curve; TCGA: The Cancer Genome Atlas; ROC: receiving operator characteristic; SNAP91: synaptosome-associated protein 91; MPCa: metastatic prostate cancer
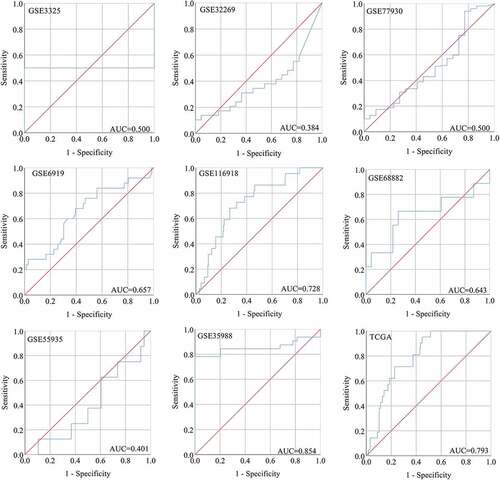
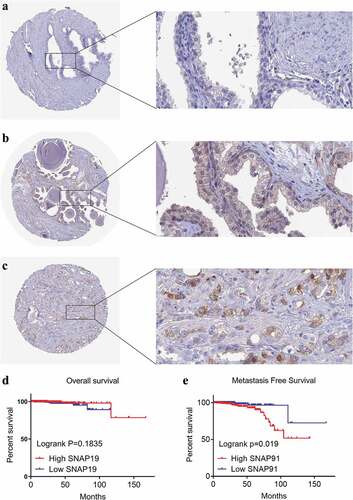
Figure 9. HPA immunohistochemistry and Kaplan-Meier analysis of SNAP91. (a) The expression level of SNAP91 protein was not detected in normal prostate tissue (Antibody HPA029633, Male, age 60). (b) The expression level of SNAP91 protein was not detected in normal prostate tissue (Antibody HPA029632, Male, Age 48). (c) The expression level of SNAP91 protein was moderate in prostate adenocarcinoma (Antibody HPA029633, Male, age 79). (d) Overall survival of patients with different SNAP91 expression in PCa. (e) Metastasis-free survival rate of patients with different SNAP91 expression in PCa. HPA: Human Protein Atlas; SNAP91: synaptosome-associated protein 91