Figures & data
Figure 1. MiR-146a-5p up-regulated in pSS patients positively regulates Th17 cell differentiation. (a) Differentially expressed miRNAs in pSS patient-derived PBMCs displayed by miRNA chips. Red denotes up-regulated miRNAs (p ≤ 0.05, FC ≥ 2); green denotes down-regulated miRNAs (p ≤ 0.05, FC ≤ 2); gray denotes the absence of significant difference. (b) miR-146a-5p expression in patient-derived and NC-derived PBMCs by RT-qPCR. (c) Induced differentiation of pSS patient-derived PBMCs into different T cell subsets in vitro, and measurement of miR-146a-5p expression in different T cell subsets by RT-qPCR. ‘anti-CD3/CD28-’ means induction in the absence of CD3/CD28 antibody and cytokines; ‘anti-CD3/CD28+’ means induction in the presence of CD3/CD28 antibody only and in the absence of cytokines. Under in vitro Th17 polarization conditions, pSS patient-derived PBMCs were transfected with miR-146a-5p inhibitor or mimics. (d, g) Changes in the percentage of Th17 cells after the transfection of the inhibitor or mimics by flow cytometry. (e, h) IL17A and IL-21 level in cell medium supernatant after the transfection of the inhibitor or mimics by ELISA. (f, i) Expression of Th17-related transcription factors RORγt, STAT3, and IRF4 and cell surface receptor IL23R mRNA after transfection of the inhibitor or mimics by RT-qPCR. ** p ≤ 0.01, *** p ≤ 0.001 by Student’s t-tests
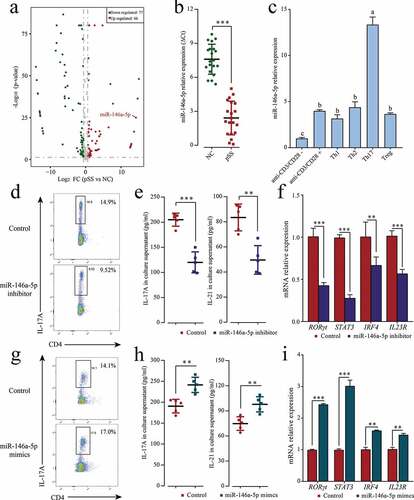
Figure 2. The increase in the percentage of Th17 cells in pSS patients. (a) Changes in the percentage of Th17 (CD4+ IL-17A+) in the PBMCs of pSS patients and NCs. (b) Changes in the proportions of Treg (CD4+ CD25+ FoxP3+) and Th1 (CD4+ IFN-γ+) in the PBMCs of pSS patients and NCs. (c) Levels of IL-21 and IL-17A in the plasma of subjects by ELISA. (d) MRNA expression of the cytokines IL-21 and IL-17A and transcription factors RORγt and STAT3 in the PBMCs of subjects by RT-qPCR. (e) pSTAT3 (Y705) protein expression in the PBMCs of subjects by WB. ns: not significant, ** p ≤ 0.01, *** p ≤ 0.001 by Student’s t-tests
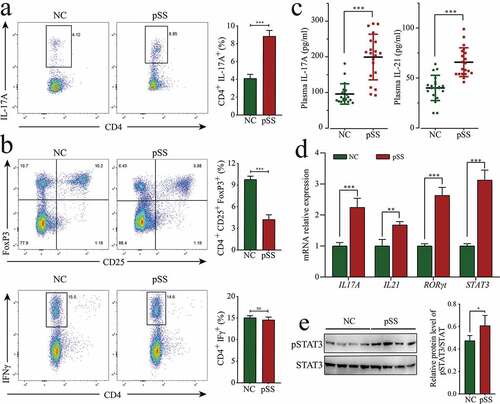
Figure 3. IL-23 significantly increases pSTAT3 expression in pSS patient-derived PBMCs, depending on the expression of IL-23 R: (a) MFI of pSTAT3 (Y705) in CD4+ and CD8+ T cells before and after IL-23 stimulation of PBMCs by flow cytometry. (b) FC of the MFI of pSTAT3 (Y705) before and after IL-23 stimulation. (c) IL-23 R protein expression in PBMCs by WB. (d, e) MFI of mIL-23 R in CD4+ and CD8+ T cells by flow cytometry. ns: not significant, * p ≤ 0.05, ** p ≤ 0.05, *** p ≤ 0.001 by ANOVA or Student’s t-test
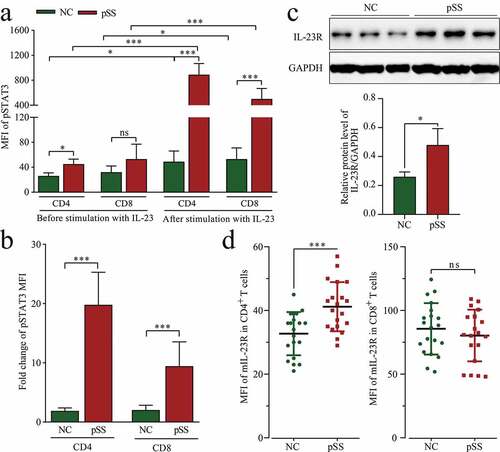
Figure 4. MiR-146a-5p targets ADAM17. PBMCs isolated from pSS patients and NCs were transfected with miR-146a-5p inhibitor and control. (a) miR-146a-5p expression and ADAM17 mRNA by RT-qPCR, and MFI of ADAM17 by flow cytometry. (b) ADAM17 protein expression by WB. (c) Transfection of pGL3 ADAM17 3ʹ UTR luciferase reporter vector or pGL3 empty vector and co-transfection of miR-146a-5p mimics at different doses in 293 T cells, and detection of MFI by Dual-Luciferase Reporter Assay System. PBMCs isolated from pSS patients and NCs were transfected with miR-146a-5p inhibitor and control. (d) IL-23 R mRNA expression by RT-qPCR, sIL-23 R level in the cell medium supernatant by ELISA, and MFI of mIL-23 R by flow cytometry. (e) IL-17A mRNA expression by RT-qPCR, and IL-17A level in the cell medium supernatant by ELISA. ns: not significant, * p ≤ 0.05, ** p ≤ 0.05, *** p ≤ 0.001 by Student’s t-tests
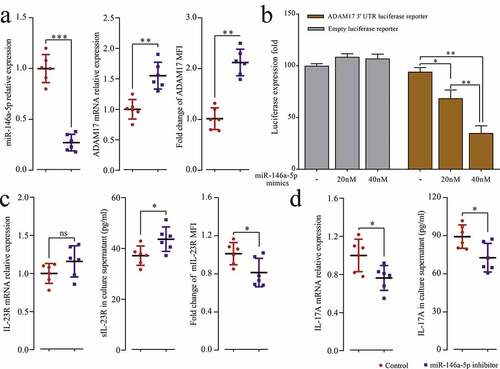
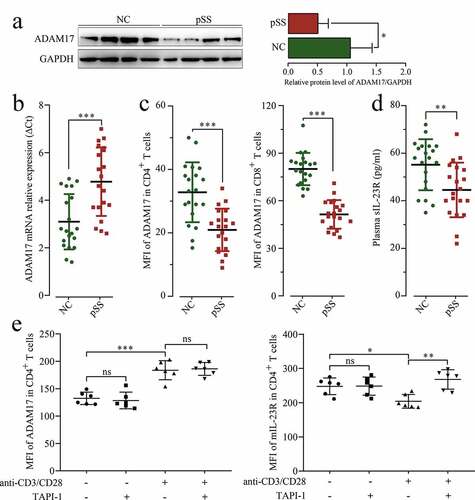
Figure 5. MIL-23 R serves as a substrate for ADAM17. (a) ADAM17 protein expression in pSS patient-derived and NC-derived PBMCs by WB. (b) ADAM17 mRNA expression in PBMCs by RT-qPCR. (c) MFI of ADAM17 in CD4+ and CD8+ T cells by flow cytometry. (d) sIL-23 R level in pSS patients and NCs plasma by ELISA. (e) In vitro culture of CD3 + T cells isolated from pSS patient-derived PBMCs with and without anti-CD3/CD28 stimulation in the presence or absence of TAPI-1, and MFI of ADAM17 and mIL-23 R in CD4+ T cells by flow cytometry. ns: not significant, * p ≤ 0.05, ** p ≤ 0.05, *** p ≤ 0.001 by ANOVA or Student’s t-test