Figures & data
Figure 1. Construction of the microfluidic chip. (a) The picture of microfluidic chip connected with micro injection pump and the schematic diagram of Immunomicrosphere detection method were drawn. (b) Material object of the microfluidic chip and the comparison between the size of the prepared microfluidic chip and a single coin. The inspection hole is dyed red after adding red dye to the sample hole. (c) Design drawing of the chip. The width of two adjacent microbarriers is 50 μm to ensure that the microspheres can be captured by the microbarriers. (d) Microbarriers and microspheres under an optical microscope (magnification 10 × 40). (e) Microbarriers and microspheres under a fluorescence microscope. The diameter of the glass microspheres is 50 ~ 90 μm. The width between a pair of microbarriers is 50 µm (10 × 100)
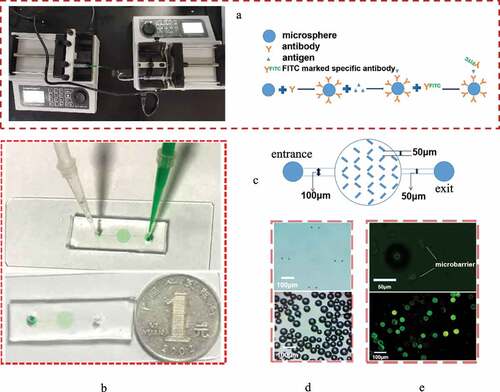
Figure 2. (a) Schematic diagram of the principle of the ATP detection method. (b) Relationship between the RLU and bacterial quantity. (c) Standard curve of bacterial growth of bacterial quantity. (d) Comparative observation of the growth curve of bacteria cultured by the microfluidic chip method and traditional 96-well plate method for 0, 2, 4, 6, 8, 10, 12, 14, and 16 h
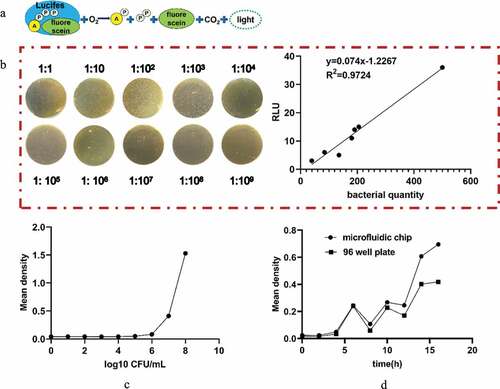
Table 1. Capture rate under different capture time (%, n = 5 x ± s)
Figure 3. (a) The appropriate speed of sample addition was selected. The fluorescence intensity of the experimental group was obviously different from that of the control group at 5 μL·min−1. (b) The capture rate of the microfluidic chip at different capture times. * P< 0.05, Comparison with the control group. (control group, only 1% BSA-sealed glass microspheres; experimental group, antibody modification on the surface of the microspheres)
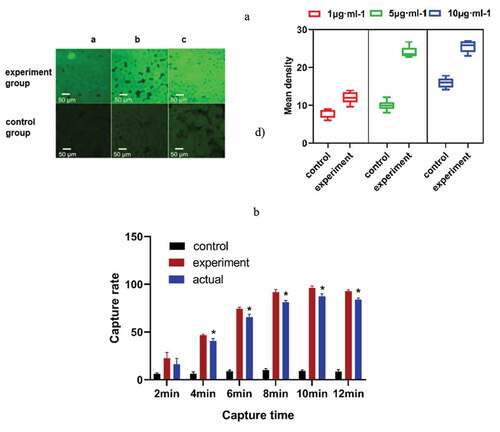
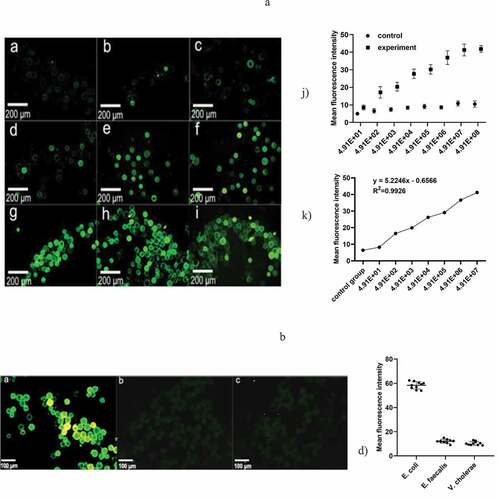
Figure 4. (a) Represents the negative control group, and b-i) represent the bacterial concentration in turn; 4.91 × 10, 4.91 × 10², 4.91 × 10³, 4.91 × 10⁴, 4.91 × 10⁵, 4.91 × 10⁶, 4.91 × 10⁷, 4.91 × 10⁸ under a fluorescence microscope, respectively (magnification 10 × 40). k) The variation of the measured OD value as a function of the concentration of the E. coli suspension. h) Standard curve of E. coli at concentrations from 4.91 × 10 ~ 4.91 × 10⁷ cfu/mL and mean fluorescence intensity. (b) a)-c) Fluorescence staining results of E. coli O157, Enterococcus faecalis and Vibrio cholerae. d) Fluorescence mean density value of the three kinds of bacteria. (control group, only 1% BSA sealed glass microspheres; experimental group, antibody modification on the surface of the microspheres)