Figures & data
Table 1. Association of miR-330-3p expression with clinicopathological factors of the ovarian cancer patients
Figure 1. The expression of miR-330-3p was downregulated in OC samples and cell lines. (a) The expression level of miR-330-3p in 30 paired OC tissues and adjacent non-tumor tissues, *P < 0.05. (b) The relative miR-330-3p expression was assessed in OC tissues. (c)The expression level of miR-330-3p in different clinical stage in OC tissues (III–IV vs. I–II), *P < 0.05. (d) Expression levels of miR-330-3p in OC cell lines, *P < 0.05
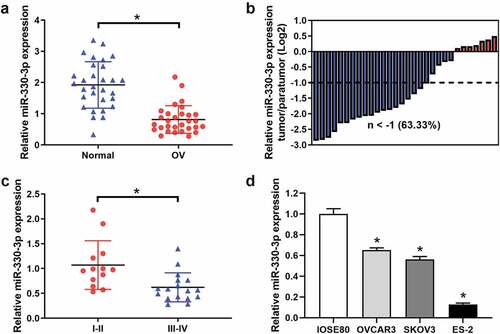
Figure 2. Overexpression of miR-330-3p inhibited ES-2 cell proliferation, migration and invasion. (a) RT-qPCR analysis was performed to assess the expression of miR-330-3p after transfected with miR-330-3p mimics and NC, *P < 0.05. (b) The proliferation of ES-2 cells after transfection was detected by MTT assay, *P < 0.05. (c,d) The migration and invasion of ES-2 cells after transfection was detected by transwell invasion and migration assays, *P < 0.05
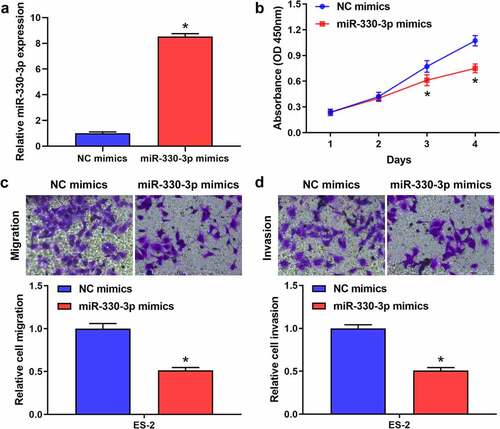
Figure 3. RIPK4 was a direct target of miR-330-3p in ES-2 cells. (a) The binding sites between RIPK4 and miR-330-3p predicted by TargetScan. (b)The binding relationship of RIPK4 to miR-330-3p validated by dual-luciferase reporter gene assay, *P < 0.05. The expression level of RIPK4 was detected using RT-qPCR (c) and western blot (d-e), *P < 0.05
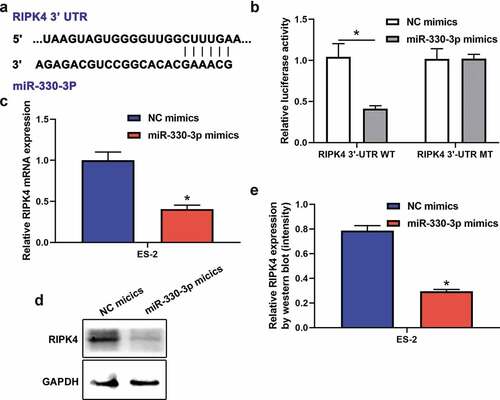
Figure 4. Overexpression of RIPK4 antagonized the effects of miR-330-3p on ES-2 cells. The inhibition effect of miR-330-3p on RIPK4 expression was rescued by RIPK4 overexpression detected using RT-qPCR (a) and western blot (b), *P < 0.05. The inhibition effect of miR-330-3p on cell proliferation, migration and invasion was partly reversed by RIPK4 overexpression detected using MTT (c) and transwell assay(d), *P < 0.05
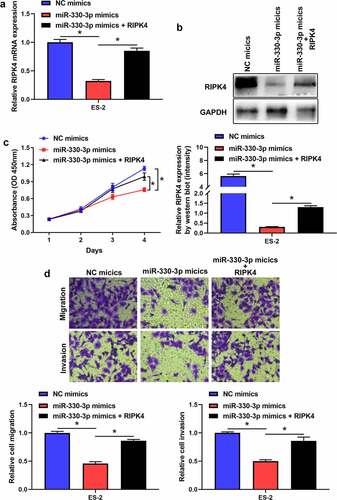
Figure 5. The expression of RIPK4 was inversely correlated with miR-330-3p expression in OV tissues