
Figures & data
Table 1. Composition of chemostat culture feed media with different C/N ratios
Table 2. Primers used for quantitative real-time PCR
Figure 1. The growth, product/byproduct generation, and glucose consumption profiles of C. glutamicum CP in fed-batch culture
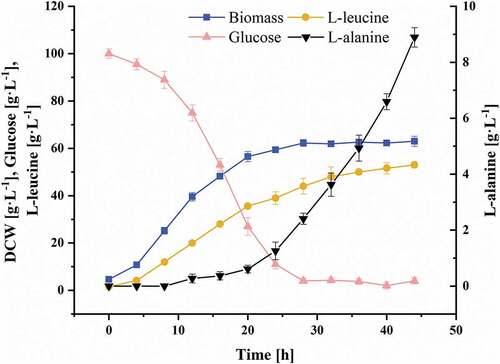
Figure 2. Effect of dilution rate on the chemostat culture of C. glutamicum CP. (a) Biomass, (b) L-leucine, (c) L-alanine, (d) Glucose. Data are presented as means ± standard deviations from three independent experiments. *p ≤ 0.05, **p ≤ 0.01, ***p ≤ 0.001
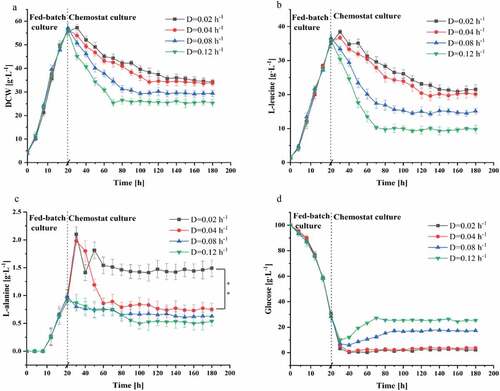
Figure 3. The effect of nitrogen source and C/N ratio on the chemostat culture of C. glutamicum CP in the steady state. (a) Biomass, (b) L-leucine, (c) L-alanine, (d) Glucose
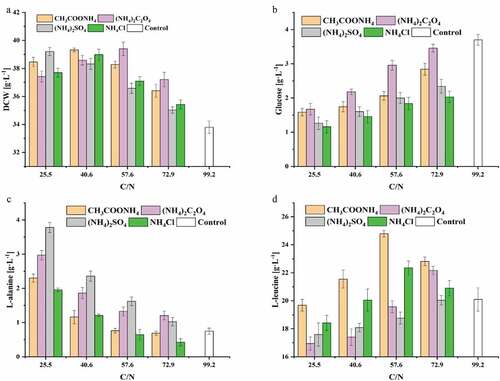
Figure 4. Comparison of gene expression levels and activities of enzymes related to the synthesis of L-leucine and L-alanine. The expression levels of the genes were measured using fluorescence quantitative RT-PCR from RNA extracted in the stationary phases during the fed-batch process and the steady state of the chemostat process. Specific activity of IPMS, IPMD, AlaT, and AvtA in crude extracts of C. glutamicum CP were determined, respectively. Data are presented as means ± standard deviations from three independent experiments. *p ≤ 0.05, **p ≤ 0.01, ***p ≤ 0.001
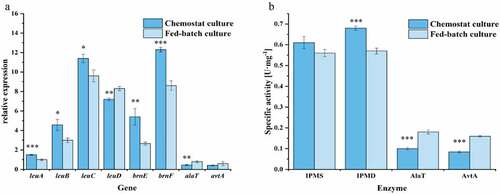
Table 3. The representative strains for production of L-leucine