Figures & data
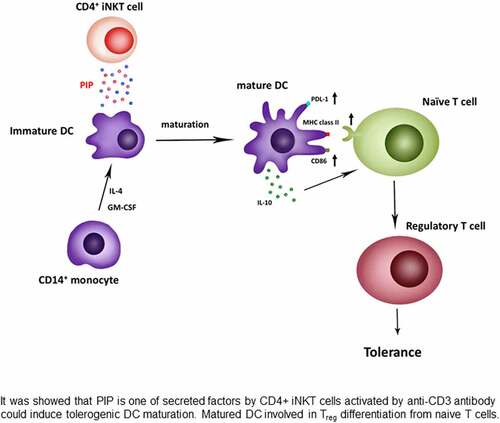
Figure 1. Construction of the CD4+ iNKT cell line. CD1d-restricted T cell clones were generated from PBMCs by cell sorting using MoFlo. Briefly, iNKT cells were sorted using 6B11 fluorochrome-conjugated Ab and sorted single cells were cultured with a mixture of irradiated (7,500 rad) allogeneic 75,000 PBMCs per well, and the clones were expanded using anti-CD3 and irradiated PBMCs. CD4+ iNKT cell clones were characterized phenotypically using a panel of cell surface Abs, including CD4 conjugated with fluorescein isothiocyanate (FITC) and NKT with phycoerythrin (PE)
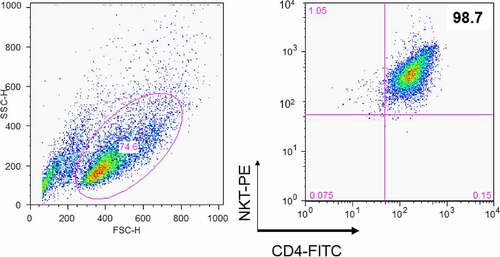
Figure 2. Purification of DC maturation factors secreted by CD4+ iNKT cells using fast protein liquid chromatography (FPLC). (a). The dendritic cell maturation effect by CD4+ iNKT cells and DN iNKT cells (n = 3). (b). HiTrap DEAE FF chromatography. (c). HiTrap CM FF chromatography. (d). HiTrap Blue HP chromatography. Protein contents of the active region of HiTrap CM FF were analyzed with mass spectrometry. ■ represents the protein concentration, ♦ represents the activity of maturate immature DCs, as assessed by FACS analysis using HLA-DR and CD86 monoclonal Abs
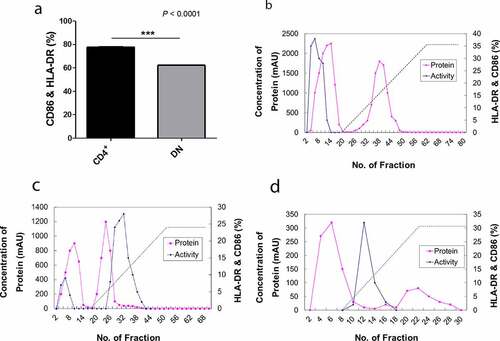
Figure 3. Expression of prolactin-induced protein (PIP) in CD4+ iNKT cells and their culture supernatant. (a). RT-PCR, (b). Western blot, (c). relative expression of PIP and (d). secreted levels of PIP, according to the concentration of anti-CD3 Ab. GAPDH: glyceraldehyde 3-phosphate dehydrogenase
Figure 4. Effect of prolactin-induced protein (PIP) on DC maturation. (a). Expression of HLA-DR, CD86, and PDL-1 on the surface of DCs matured by 1 µg each of LPS and PIP (n = 3). (b). FACS profile of mature DCs. (c). Dose-dependent dendritic cell maturation effect of PIP. The maturation of immature DCs was assessed by FACS analysis of the expression levels of PDL-1, CD86, and HLA-DR on DC surfaces. *p < 0.05; **p < 0.001. Results are representative of three independent experiments. Error bars indicate means ± SD
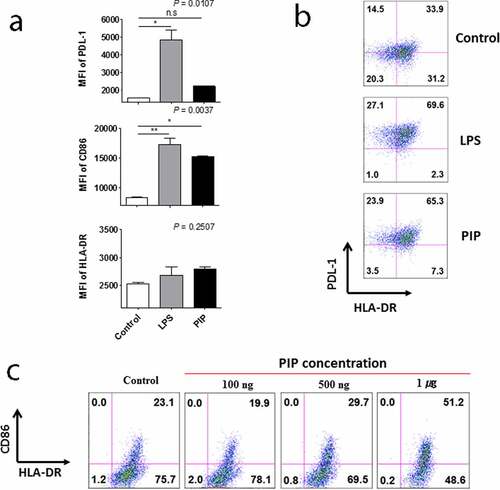
Figure 5. Comparison of IL-10 and IL-12(p70) production in response to LPS, (a), and PIP treatment of DCs, (b). IL-1β, (c), and TNF-α, (d), production by LPS- and PIP-treated DCs. Immature DCs were cultured for 48 hours with PIP or LPS to allow the induction of tolerogenic DCs. Cytokines were analyzed by the Bio-Plex Pro Human Cytokine 17-plex Assay kit. * p < 0.05; ** p < 0.001; *** p < 0.0001. Results are from biological replicate experiments. Error bars indicate means ± SD
Figure 6. Recombinant prolactin-induced protein (PIP) induces CD4+CD25+Foxp3+ T (Treg) cells by inducing the maturation of immature DC. (a). To mature these DCs, CD14+ monocytes were cultured with GM-CSF and IL-4 for 5 days. Immature DCs were cultured for 48 h with PIP to allow the induction of tolerogenic DCs. Tolerogenic DCs were co-cultured with CFSE-labeled CD4+CD25−Foxp3− T cells and 500 ng/ml anti-CD3 Ab, 500 ng/ml anti-CD28 Ab, and 50 U/ml IL-2 for 5 days. The development of Treg cells was assessed by FACS analysis of the expression levels of CD4, CD25, and Foxp3. (b). Treg generation by PIP-treated DCs isolated from healthy volunteers (n = 5)
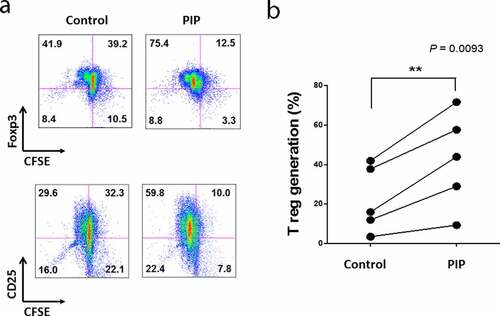
Figure 7. Blocking effect of anti-TLR antibodies on DC maturation. Anti-TLR antibodies (1 µg/ml) were pre-cultured with immature DCs for 1 h before adding 500 ng/ml recombinant PIP. The maturation of immature DC was assessed by FACS analysis of the expression level of CD86 on DC surfaces. * p < 0.05. ** p < 0.01, *** p < 0.001. Results are from biological replicate experiments. Error bars indicate means ± SD
Figure 8. Blocking effect of anti-RAGE Ab on DC maturation. Anti-RAGE Ab (1 µg/ml) was pre-cultured with immature DCs for 1 h before adding 500 ng/ml recombinant PIP. The maturation of immature DCs was assessed by FACS analysis of HLA-DR expression on DC surfaces. *p < 0.05. Results are from biological replicate experiments. Error bars indicate means ± SD
Figure 9. Generation of Treg cells with various concentrations of recombinant PIP and blocking the generation of Th1 and Th17 cells. (a). Tolerogenic DCs were induced by treatment with PIP. CFSE-labeled CD4+CD25−Foxp3− T cells were added to tolerogenic DCs to evaluate Treg generation by FACS analysis. (b). Inhibition of Treg generation by PIP siRNA and/or S100A8 siRNA treatment of CD4+ iNKT cells. (c). Inhibition of Th1 cells by Pam3CSK4 through Treg cells generated by recombinant PIP. (d). Inhibition of Th17 cells by Pam3CSK4 through Treg cells generated by recombinant PIP. Immature DCs were matured with PIP and/or Pam3CSK4 together. CFSE-labeled naïve T cells were added to mature DCs to evaluate Th1 and Th17 cell generation by FACS analysis after 8 days. Results are from biological replicate experiments. Error bars indicate means ± SD
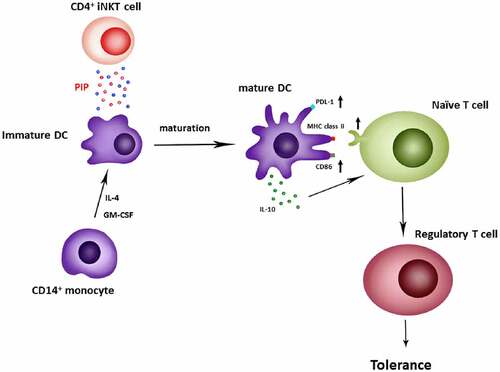
Figure 10. Generation of regulatory T cells through PIP secreted from CD4+ iNKT cells. Anti-CD3/anti-CD28 Ab-activated CD4+ iNKT cells secrete PIP to upregulate PDL-1, MHC class II, and CD86 expression on the surfaces of DCs. Matured DCs also secrete IL-10 cytokine. Finally, mature DCs induce regulatory T cell proliferation from naïve T cells