Figures & data
Table 1. GEO database data of preeclampsia mRNA expression profile
Figure 1. A. The immune cell infiltration in PE and normal samples. B. The difference of immune cell infiltration between PE and normal samples (Wilcoxon’s test, p < 0.05)
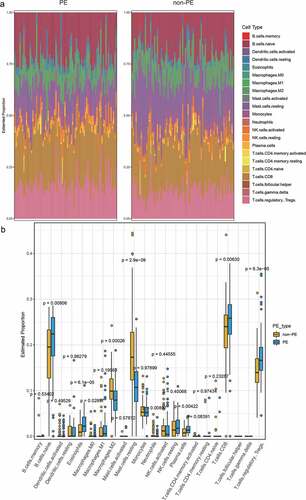
Figure 2. A. The differentially expressed immune-related genes (volcano plot). B. The 25 most differentially expressed upregulated and downregulated immune-related genes were selected to compare their expression differences
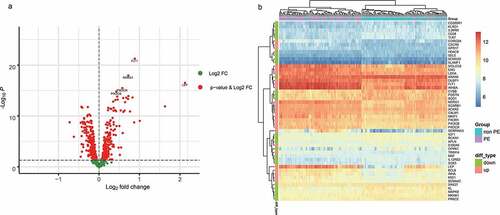
Figure 3. Functional enrichment results of differentially expressed immune-related genes
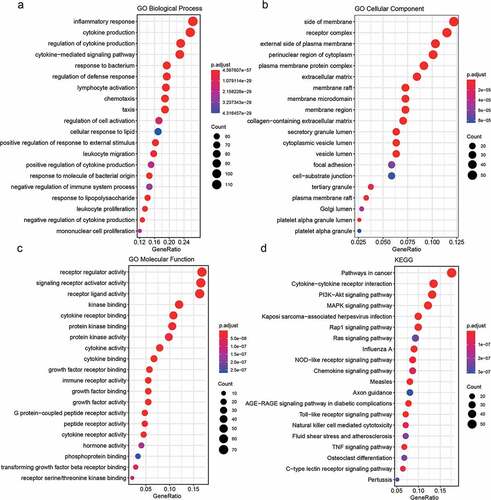
Figure 4. A, B. Analysis of network topology for various soft-thresholding powers. C. Gene dendrogram and module colors
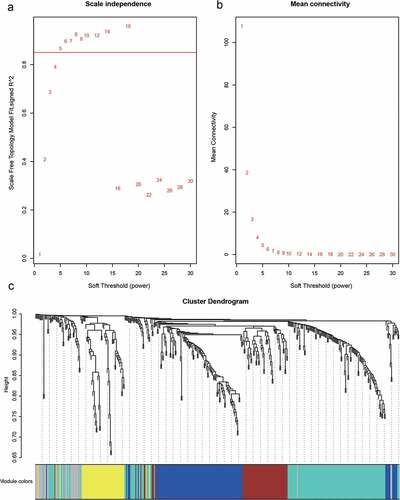
Table 2. Gene statistics corresponding to each module
Figure 5. Module–trait relationships
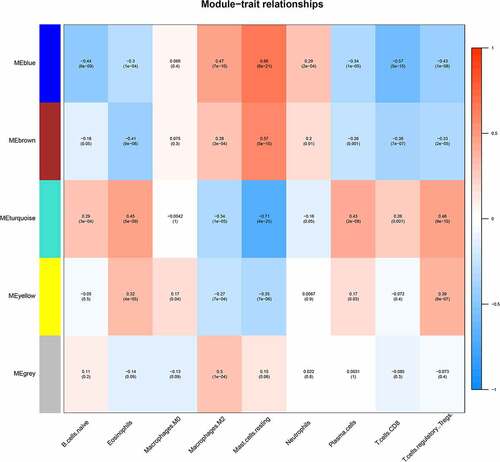
Figure 6. A, B. The genes and modules of the blue and brown modules and the correlation of different immune cell characteristics. C. The interaction network of the blue and brown modules. In the figure, blue represents the genes of the blue module, brown represents the genes of the brown module, node size represents the degree of the node. D. Venn diagram of the candidate hub gene and PPI network graph
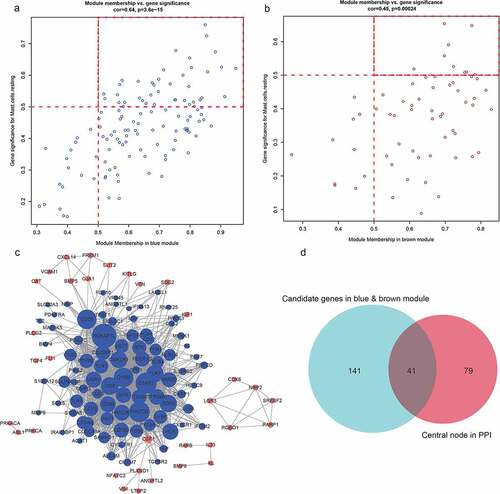
Figure 7. Correlation between hub genes and clinical features
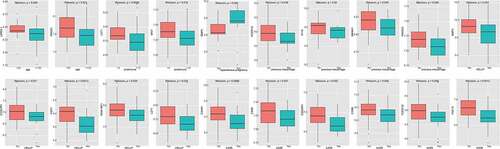
Figure 8. A. Use of SSSE to find the best inflexion. B. The cluster of PE subtypes. C. Based on Tsne to show PE subtypes. D. The expression of 41 hub genes in PE subtypes [log2(EXP + 1) scale]
![Figure 8. A. Use of SSSE to find the best inflexion. B. The cluster of PE subtypes. C. Based on Tsne to show PE subtypes. D. The expression of 41 hub genes in PE subtypes [log2(EXP + 1) scale]](/cms/asset/9c2d02db-c6d5-4980-a00e-38f2ad3bd63e/kbie_a_1875707_f0008_oc.jpg)
Figure 9. A. The immune cell infiltration in cluster 1 and cluster 2. B. The difference of immune cell infiltration between cluster 1 and cluster 2 (Wilcoxon’s test, p < 0.05)
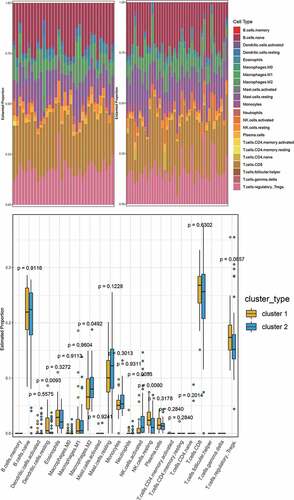
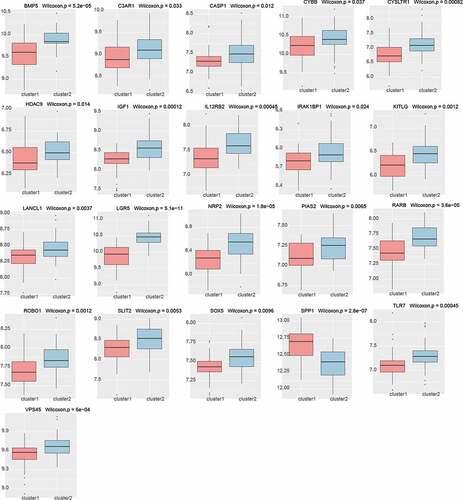
Figure 10. Differential expression of hub genes in different PE subclasses (21/41, Kruskal–Wallis, p < 0.05)