Figures & data
Figure 1. LINC00265 is overexpressed in GC tissue samples and cell lines. (a) The expression of LINC00265 was analyzed in 32 pairs of GC tissue samples and adjacent normal gastric tissues using RT-qPCR. *P < 0.05 vs. the normal gastric tissues. (b) RT-qPCR was performed to determine LINC00265 expression in eight GC cell lines (KATO-III, SGC-7901, BGC-823, HGC-27, AGS, NCI-N87, SNU-1, and SNU-16) and normal gastric cells (GES cells). *P < 0.05 vs. GES cells
Figure 2. LINC00265 knockdown inhibits GC cell growth in vitro. (a) NCI-N87 and KATO III cells were transfected with either si-LINC00265 or si-NC. At 48 h post-transfection, the cells were collected and, then, subjected to RT-qPCR analysis for transfection efficiency evaluation. *P < 0.05 vs. the si-NC group. (b) The CCK-8 assay was conducted to assess cellular proliferation after 0, 3, 5, and 7 day of cultivation of si-LINC00265-transfected or si-NC-transfected NCI-N87 and KATO III cells. *P < 0.05 vs. group si-NC. (c) Colony formation assay was performed to determine the proliferation ability of NCI-N87 and KATO III cells after transfection with either si-LINC00265 or si-NC. *P < 0.05 vs. the si-NC group
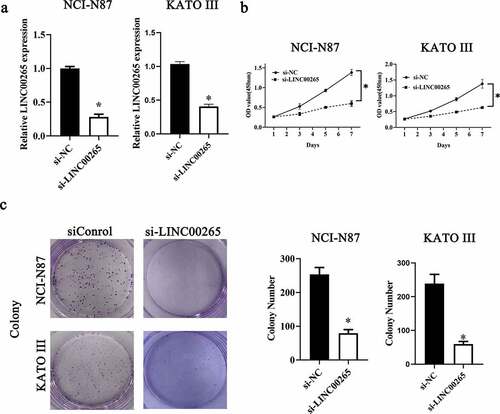
Figure 3. LINC00265 functions as a ceRNA for miR-144 in GC cells. (a) The distribution of LINC00265 within GC cells was determined by the nuclear/cytoplasmic fractionation assay. (b) The wild-type miR-144-binding sequences in LINC00265, as predicted by starBase 3.0. The mutations in the LINC00265 sequence that disrupt the interaction between LINC00265 and miR-144 are shown too. (c) NCI-N87 and KATO III cells that were transfected with either agomiR-144 or agomir-NC were harvested and analyzed for miR-144 expression by RT-qPCR. *P < 0.05 vs. the agomir-NC group. (d) Luciferase reporter assays were performed on NCI-N87 and KATO III cells that were transfected with either agomiR-144 or agomir-NC and either LINC00265-wt or LINC00265-mut. *P < 0.05 vs. group agomir-NC. (e) The expression profile of miR-144 in the 40 pairs of GC tissues and adjacent-normal-gastric tissue samples was analyzed by RT-qPCR. *P < 0.05 vs. the normal tissues. (f) Expression of miR-144 in NCI-N87 and KATO III cells transfected with either si-LINC00265 or si-NC was determined by RT-qPCR. *P < 0.05 vs. the si-NC group
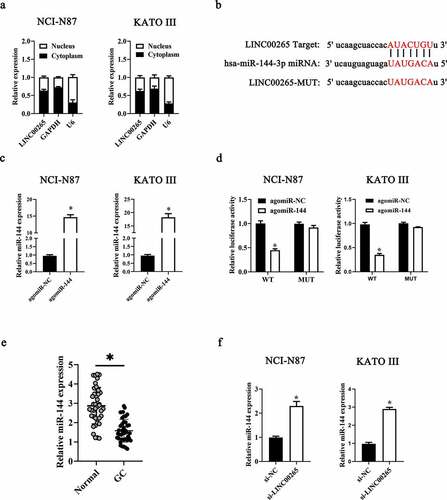
Figure 4. MiR-144 exerts a suppressive effect on GC cell growth in vitro. (a) The CCK-8 assay uncovered a change in proliferation of miR-144-overexpressing NCI-N87 and KATO III cells. *P < 0.05 vs. group agomir-NC. (b) NCI-N87 and KATO III cells were treated with either agomiR-144 or agomir-NC. After the transfection, Colony formation assays were carried out. *P < 0.05 vs. group agomir-NC
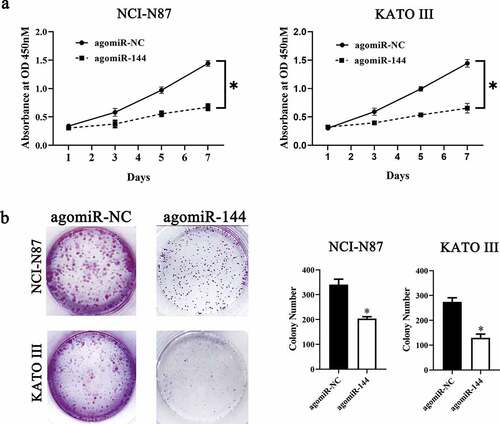
Figure 5. LINC00265 sponges miR-144-3p to upregulate CBX4 expression in GC cells. (a) MiR-144 and its wild-type binding site in the 3′-UTR of CBX4 mRNA. The mutations were introduced into the site complementary to the seed region of miR-144. (b) The luciferase reporter assay was performed to test whether the 3′-UTR of CBX4 mRNA could be directly targeted by miR-144 in GC cells. NCI-N87 and KATO III cells were cotransfected with either agomiR-144 or agomir-NC and either the CBX4-wt or CBX4-mut plasmid. After 48 h of cultivation, the transfected cells were assayed with the Dual-Luciferase Reporter Assay System to measure the luciferase activity. *P < 0.05 vs. the agomir-NC group. (c, d) Expression levels of CBX4 mRNA and protein in miR-144-overexpressing NCI-N87 and KATO III cells were respectively determined by RT-qPCR and western blotting. *P < 0.05 vs. the agomir-NC group. (e) Expression levels of miR-144 in NCI-N87 and KATO III cells transfected with antagomiR-144 or antagomir-NC. (f, g) Si-LINC00265 in combination with either antagomiR-144 or antagomir-NC was transfected into NCI-N87 and KATO III cells. After 48 h transfection, expression levels of the CBX4 protein and miR-144 were determined respectively by western blotting and RT-qPCR. *P < 0.05 vs. group si-NC. #P < 0.05 vs. group si-LINC00265+ antagomir-NC
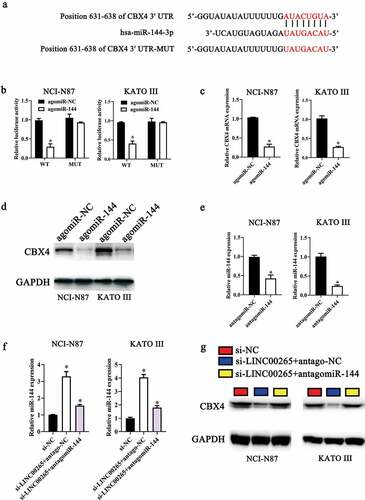
Figure 6. CBX4 is overexpressed in GC tissue samples and cell lines. (a) The expression of CBX4 was analyzed in 32 pairs of GC tissue samples and adjacent normal gastric tissues using RT-qPCR. *P < 0.05 vs. the normal gastric tissues. (b) RT-qPCR was performed to test CBX4 expression in eight GC cell lines (KATO-III, SGC-7901, BGC-823, HGC-27, AGS, NCI-N87, SNU-1, and SNU-16) and normal gastric cells (GES cells). *P < 0.05 vs. GES cells
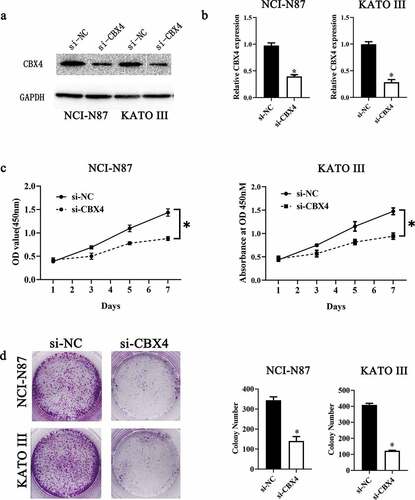
Figure 7. CBX4 exerts a promotive effect on GC cell growth in vitro. (a, b) NCI-N87 and KATO III cells were transfected with either si-LINC00265 or si-NC. At 48 h post-transfection, the cells were collected and, then, subjected to western blotting and RT-qPCR analysis for transfection efficiency evaluation. (c) The CCK-8 assay showed a change in proliferation of CBX4-knockdown NCI-N87 and KATO III cells. *P < 0.05 vs. group agomir-NC. (d) NCI-N87 and KATO III cells were treated with either agomiR-144 or agomir-NC. After the transfection, Colony formation assays were carried out. *P < 0.05 vs. group agomir-NC