
Figures & data
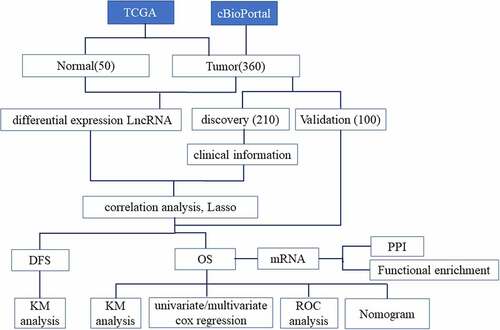
Table 1. Clinicopathological characteristics of 360 hepatocellular carcinoma patients
Figure 1. LncRNAs profiling of tumor and para-carcinoma tissues. (a) Heat-map showing profiles of lncRNAs in tumor and para-carcinoma tissues. red represented that the expression of lncRNAs is relative upregulation, blue represented that the expression levels of lncRNAs is relative downregulation. (b) Volcano plots of differential expression lncRNAs in HCC and para-carcinoma tissues. the red points represented up-regulated lncRNAs (1< log2-fold change< 2, P < 0.05). the green points represented down-regulated lncRNAs (−2< log2-fold change< -1, P < 0.05). the blue points represented up-regulated and down-regulated lncRNAs (| log2-fold change | >2, P < 0.05). each black point represented genes with a non-significant difference
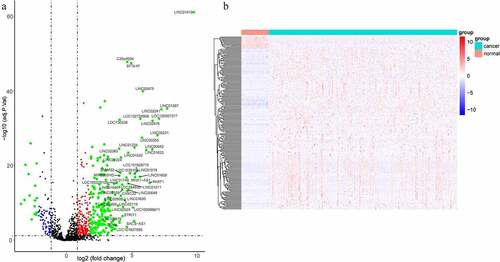
Figure 2. LncRNA-based prognostic signature of HCC. (a)(b) LASSO cox analysis showed Nineteen genes were associated with OS in the discovery group. (c)(d) LASSO cox analysis showed Fifteen genes were associated with DFS in the validation group. (e)Prognostic scores distribution for the discovery group in OS. (f) Prognostic scores distribution for the validation group in DFS
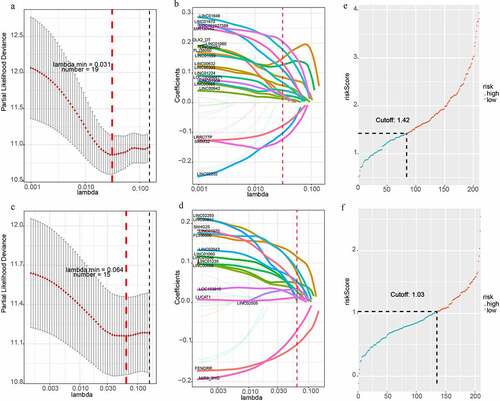
Figure 3. Kaplan-Meier analysis of HCC in the discovery group. (a) Kaplan–Meier curve of OS in the discovery group. (b) Kaplan–Meier curve of DFS in the discovery group
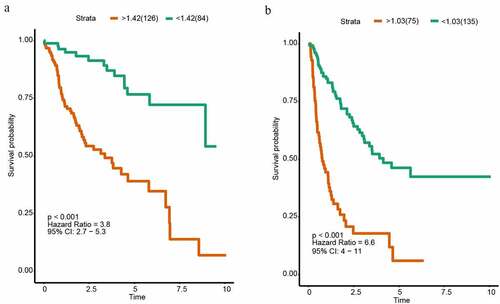
Table 2. Univariate and multivariate Cox PH regression in survival analysis
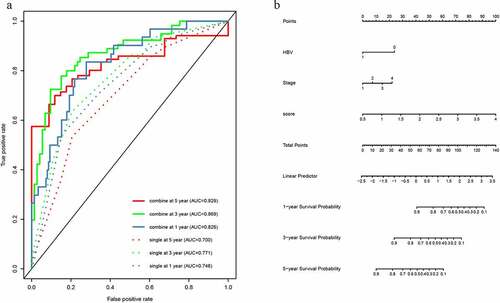
Figure 4. The time-dependent ROC analysis and nomogram for the lncRNA-based prognostic signature. (a)The time-dependent ROC analysis of the combined model included the clinicopathological information and the single model included clinicopathological information. (b) A nomogram to predict the probability of OS in hepatocellular carcinoma
Supplemental Material
Download ()Availability of data and materials
The datasets generated and analyzed during the current study are obtained from TCGA (https://portal.gdc.cancer.gov) and cBioPortal database (https://www.cbioportal.org/).