Figures & data
Figure 1. Low-concentration ligustrazine had a protective effect on RGCs after retinal I/R injury. After incubation with different concentrations of ligustrazine (0, 5, 10, 20, 40, 80, 160, or 320 μg/mL), CCK-8 assay was perfumed to verify the effect of ligustrazine on the cell viability of RGCs after retinal I/R injury. **p< 0.01 vs. normal group; ##p< 0.01 vs. model group
Figure 2. Inhibition of PI3K or mTOR reduced ligustrazine-mediated protection of RGCs after I/R injury. RGCs with retinal I/R injury were treated with 10 μg/mL ligustrazine alone or with 10 µM Ly294002 or 10 μM rapamycin. **p< 0.01 vs. normal group; ##p< 0.01 vs. model group. $$p< 0.01 vs. ligustrazine group
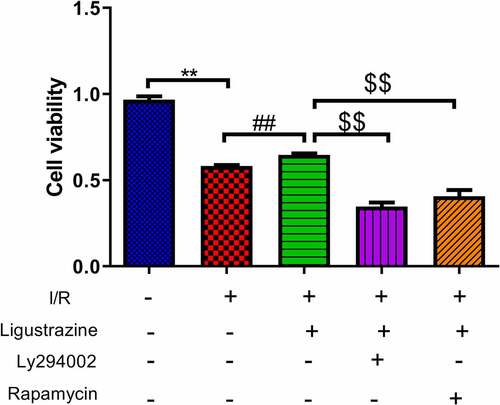
Figure 3. Inhibition of PI3K or mTOR reversed the suppressed autophagy and apoptosis mediated by ligustrazine in RGCs induced by retinal I/R injury. (a) After treatment with ligustrazine alone or ligustrazine with Ly294002 or rapamycin, the autophagy of RGCs after retinal I/R injury was identified by TEM. Yellow arrows indicate the number of autophagosomes. (b) The number of autophagosomes was counted, n = 3; **p< 0.01 vs. normal group; ##p< 0.01 vs. model group. $p< 0.05 vs. ligustrazine group. (c) Apoptosis was determined by TUNEL staining in the treated retinal I/R model. Magnification, 100 ×; Scale bar = 100 μm. (d) Apoptosis rate of the treated retinal I/R model RGCs was determined. **p< 0.01 vs. normal group; ##p< 0.01 vs. model group. $$p< 0.01 vs. ligustrazine group
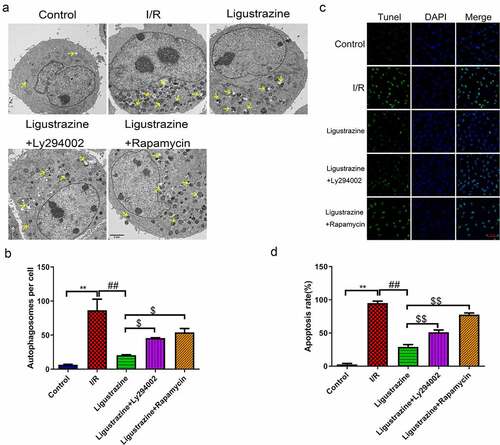
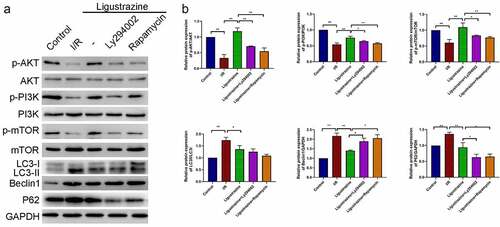
Figure 4. PI3K/Akt/mTOR pathway participated in ligustrazine-mediated autophagy in RGCs induced by retinal I/R injury. (a) After ligustrazine treatment, I/R-induced RGCs were treated with Ly294002 or rapamycin. Western blotting was performed to evaluate p-AKT, AKT, p-PI3K, PI3K, p-mTOR, mTOR, LC3, Beclin1 and P62 expression levels. (b) The relative expression levels of all proteins were calculated based on the gray values in each group. *p< 0.05, **p< 0.01; Gray values indicate relative expression levels of proteins