Figures & data
Figure 1. The biological functions and signaling pathways of the 93 genes in TCGA. A. GO; B. KEGG
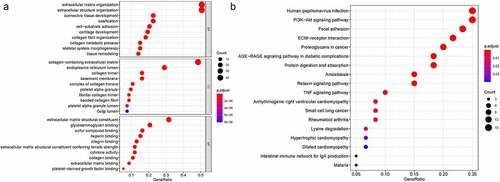
Figure 2. The results of EMT-related gene signature based on TCGA. A. the AUC values of the risk factors; B. the AUC values of the patients’ 1, 3, 5-year survival rate; C. risk score distribution map and the survival status map; D. PCA analysis; E. t-SNE analysis
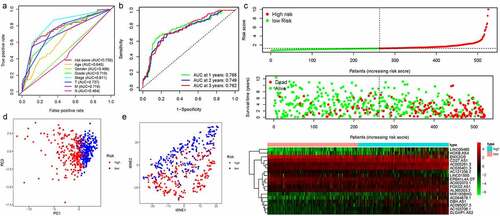
Figure 3. Kaplan-Meier results demonstrated that 18 DELs expression significance effect patient’s OS
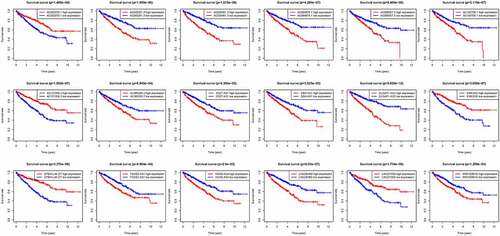
Figure 4. Kaplan-Meier results of our risk model and univariate/multivariate cox analysis to determine if risk score was an independent prognostic predictor of OS. A. Kaplan-Meier results; B. univariate; C. multivariate
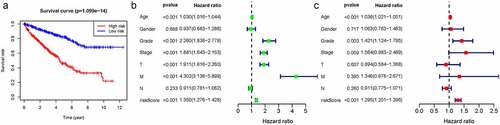
Figure 5. The nomogram was constructed from the clinicopathological data as well as the developed prognostic model
Figure 6. Cytoscape explored the potential link between lncRNA and target genes
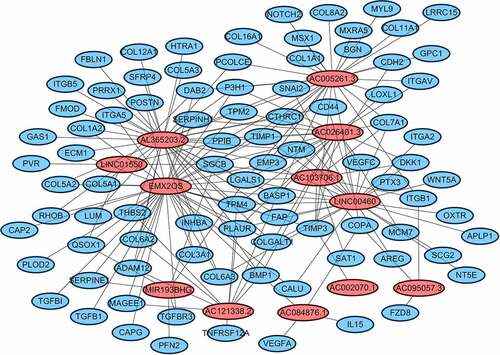
Figure 7. Functional annotation was performed through GSEA among high risk group
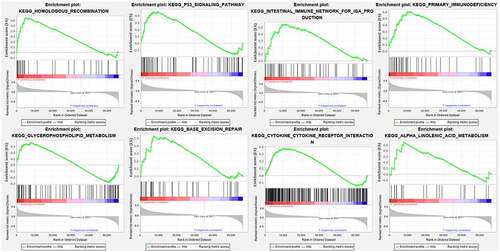
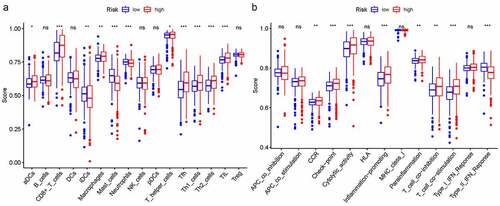
Figure 8. The relationship between immune status and risk scores with ssGSEA. A. immune function; B. immune cells