Figures & data
Table 1. Relationship between TTN-AS1 expression and clinicopathological features
Figure 1. TTN-AS1 expression was significantly up-regulated in HCC tissues and cell lines
(a-b) qRT-PCR showed that TTN-AS1 expression was up-regulated in HCC tissues (a) and cell lines (b).(c-d) GEPIA database showed high TTN-AS1 expression was related to shorter overall survival time (c) and disease-free survival time (d).Student’s t-test and one-way ANOVA test, *** P < 0.001.
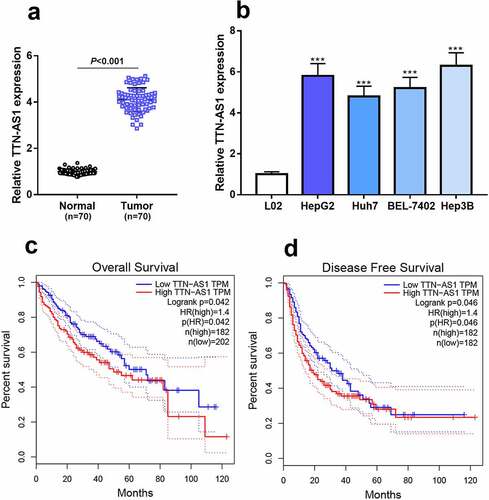
Figure 2. TTN-AS1 knockdown could inhibit the proliferation, migration, invasion, and EMT of HCC cells
(a) qRT-PCR showed that TTN-AS1 expression in HCC cells was decreased after the transfection of TTN-AS1 shRNAs.(b-c) CCK-8 assay showed that HCC cell proliferation was decreased after the transfection of TTN-AS1 shRNAs.(d) EdU assay showed that HCC cell proliferation was inhibited after the transfection of TTN-AS1 shRNAs.(e-f) Transwell assay showed that HCC cell migration and invasion were repressed after the transfection of TTN-AS1 shRNAs.(G-H) Western blot assay showed that the expression level of E-cadherin was increased, and expression levels of N-cadherin and Vimentin were decreased in HepG2 and Hep3B cells after the transfection with TTN-AS1 shRNA. Student’s t-test, * P < 0.05, ** P < 0.01, *** P < 0.001.
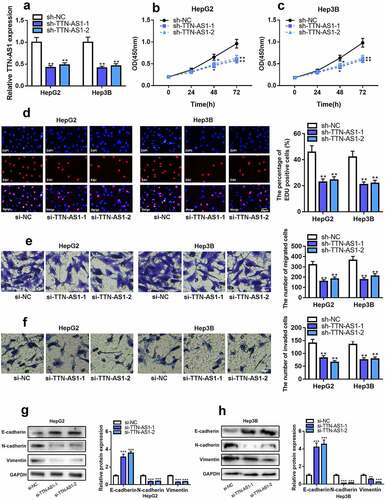
Figure 3. TTN-AS1 adsorbed miR-139-5p as a sponge to regulate the expression of SPOCK1
(a-b) Luciferase reporter assay validated the binding sites between TTN-AS1 and miR-139-5p as well as between miR-139-5p and SPOCK1 3ʹUTR. (c-d) qRT-PCR showed that miR-139-5p expression in HCC tissues and cell lines was decreased. (e-f) qRT-PCR and Western blot assay showed that SPOCK1 mRNA and protein expression levels in HCC tissues and cell lines were increased. (g-i) Pearson’s correlation analysis showed that, in HCC samples, miR-139-5p expression was negatively correlated with TTN-AS1 expression and SPOCK1 mRNA expression, and TTN-AS1 expression was positively correlated with SPOCK1 mRNA expression. (j) qRT-PCR showed that the expression of miR-139-5p was increased in HCC cells after transfection of TTN-AS1 shRNA.(k-l) qRT-PCR and Western blot showed that SPOCK1 mRNA and protein expression levels were decreased after the transfection of TTN-AS1 shRNA, but these effects were reversed by the co-transfection of miR-139-5p inhibitor. Student’s t-test, one-way ANOVA test, * P < 0.05, ** P < 0.01 and *** P < 0.001.
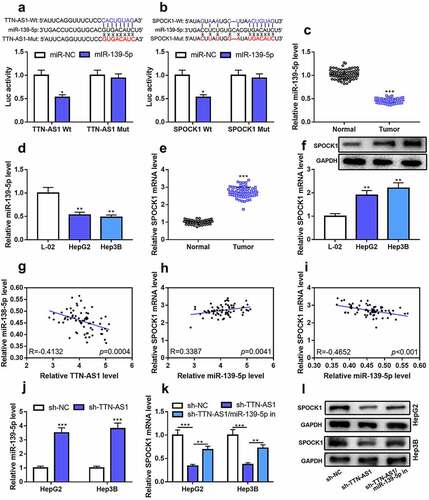
Figure 4. Overexpression of SPOCK1 could reverse the effects of knocking down TTN-AS1 on the proliferation, migration, invasion, and EMT of HCC cells
(a-b) qRT-PCR showed that the expressions of SPOCK1 mRNA and protein in HCC cells were suppressed after the transfection of TTN-AS1 shRNA, and these effects were reversed after the co-transfection of SPOCK1 overexpression plasmids. (c-d) CCK-8 assay showed that HCC cell proliferation was repressed after the transfection of TTN-AS1 shRNA, which was counteracted by SPOCK1 overexpression plasmids. (e) EdU assay showed that HCC cell proliferation was suppressed after the transfection of TTN-AS1 shRNA, which was counteracted by SPOCK1 overexpression plasmids. (f-g) Transwell assay showed that cell migration and invasion were inhibited after the transfection of TTN-AS1 shRNA, which were counteracted by SPOCK1 overexpression plasmids. (h-i) Western blot indicated that, in HCC cells, TTN-AS1 knockdown promoted E-cadherin expression, and inhibited N-cadherin expression and Vimentin expression; however, these effects could be reversed by SPOCK1 restoration. Student’s t-test, * P < 0.05, ** P < 0.01, and *** P < 0.001.
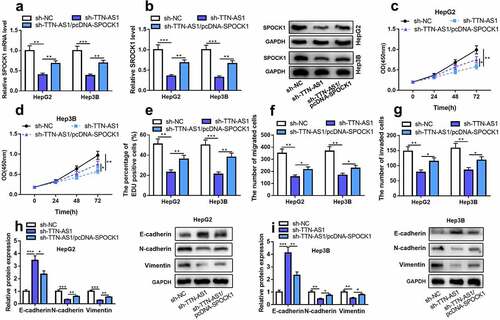
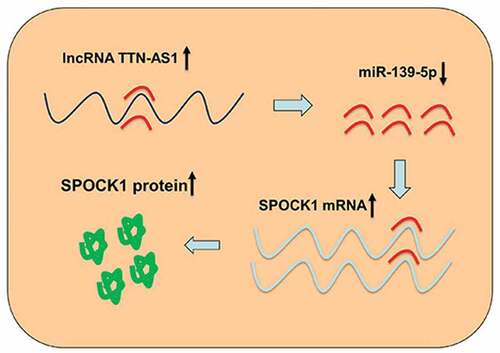
Figure 5. Graphic abstract
LncRNA TTN-AS1 is a ceRNA for miR-139-5p, and it can up-regulate SPOCK1 to facilitate HCC progression.