Figures & data
Figure 1. TEAD4 interacted with YAP1 in KYSE30 cells. The overexpression effects of OV-TEAD4 plasmids in KYSE30 cells were analyzed through RT-qPCR (a) and Western blot(b). the detection of YAP1 and CTGF expression through RT-qPCR (c) and Western blot (d). the analysis of immunoprecipitation pulled down by magnetic bead-TEAD4 antibody for YAP1 and TEAD4 expression in KYSE-30 cells (e) and KYSE-30 cell with OV-TEAD4 plasmids transfection (f). The experimental data were presented as mean±SD. Asterisks indicate that difference between two groups is statistically significant. **p < 0.01, ***p < 0.001
Figure 2. TEAD4-YAP1 complex induced proliferation of KYSE-30 cells. The detection of proliferation of KYSE-30 cells through CCK8 assay (a), colony formation (b-c) and EDU staining (d). The experimental data were shown as mean±SD. Asterisks or hashes indicate that difference between two groups is statistically significant. **p < 0.01, ***p < 0.001 versus Ov-NC, #p < 0.05, ##p < 0.01, ###p < 0.001 versus OV-TEAD4
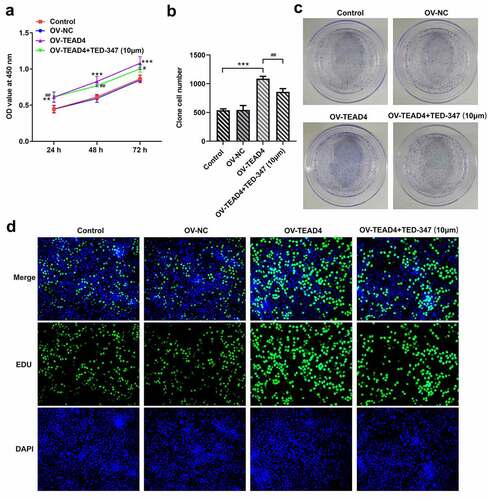
Figure 3. The enhancement of the migration and invasion of KYSE-30 cells through interaction of TEAD4 and YAP1. The detection of migration (a) and invasion (b) of KYSE-30 cells, as well as the assessment of expression of MMP2 and MMP9 through Western blot assay (c-d). The height of the bar chart indicated the mean (±SD) of experimental data. Asterisks or hashes indicate that difference between two groups is statistically significant. **p < 0.01, ***p < 0.001 versus Ov-NC. #p < 0.05, ##p < 0.01 versus OV-TEAD4
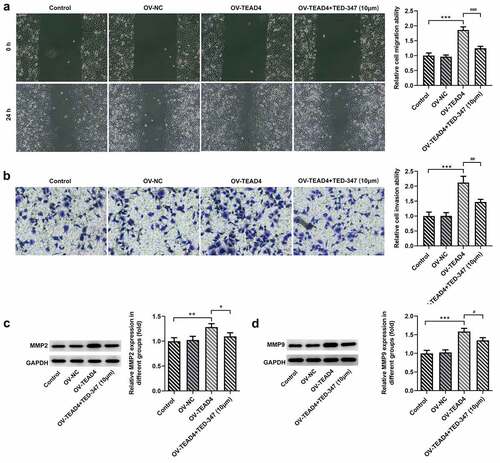
Figure 4. The subcutaneous injection of KYSE-30 cells with TEAD4 overexpression or in combination with TED-37 treatment affects tumor growth. After induction of 21 days, the photos of mice in different groups (a). The weight (b), tumor volume (c), and tumor weight (d) were detected. The immunohistochemical staining of Ki67 (e) and the expression levels of MMP2 and MMP9 through Western blot (f–g). The experimental data was shown as mean±SD. Asterisks or hashes indicate that difference between two groups is statistically significant. **p < 0.01, ***p < 0.001 versus control, #p < 0.05, ##p < 0.01 versus OV-TEAD4
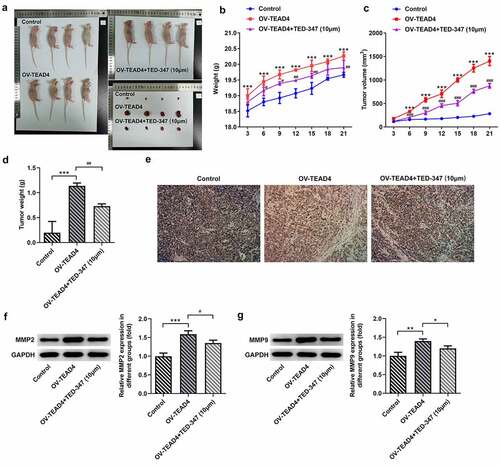
Figure 5. TED-347 blocked the effects of TEAD4 overexpression on the protein levels of SGK1 and CTGF. Western blot analysis of SGK1 and CTGF in KYSE-30 cells with OV-TEAD4 transfection or in combination with TED-347 treatment, **p < 0.01, #p < 0.05 (a) and tumor-bearing mice (b). The protein levels were normalized to that of GAPDH. The detection of luciferase activities through the transfection of OV-TEAD4 or in combination with TED-347 treatment (c). The experimental data were represented by mean±SD. Asterisks or hashes indicate that difference between two groups is statistically significant. **p < 0.01, ***p < 0.001 versus #p < 0.05 ###p < 0.001
Figure 6. SGK1 silencing suppressed proliferation of KYSE-30 cells. Quantitative PCR (a) and Western blot analysis (b) of SGK1 mRNA and protein, respectively, the detection of cell proliferation through CCK8 assay (c), colony formation and EDU staining (d). The experimental data were represented by mean±SD. Asterisks indicate that difference between two groups is statistically significant. *p < 0.05, ***p < 0.001
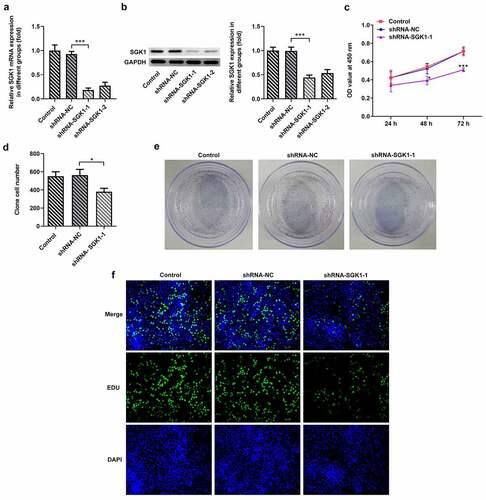
Figure 7. SGK1 silencing inhibited the migration and invasion of KYSE30 cells. The analysis of cell migration through Wound healing assay (a) and invasion through Transwell assay (b), and western blot analysis of MMP2 and MMP9 expression. The experimental data were represented by mean±SD. Asterisks indicate that difference between two groups is statistically significant. ***p < 0.001
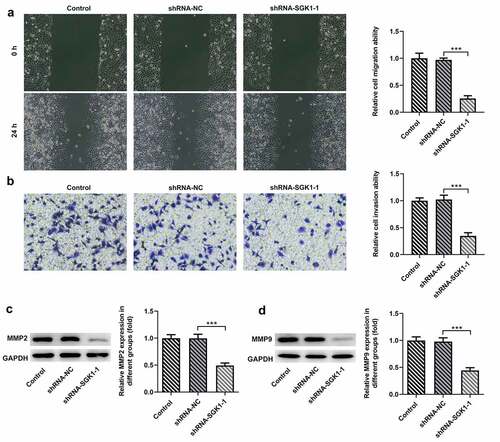
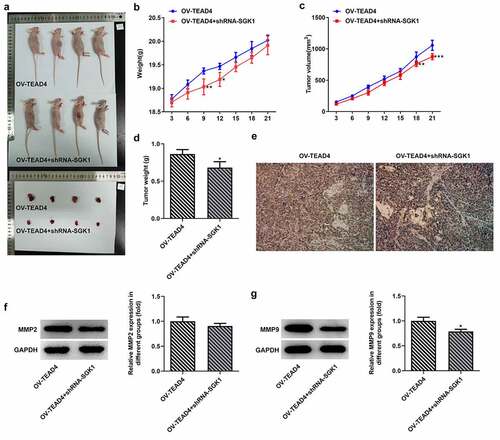
Figure 8. SGK1 could mediate the effect of TEAD4 on tumor growth. The pictures (a) of the weight (b), tumor volume and tumor weight of nude mice. The Ki67 expression (e) through immunostaining assay and the expression of MMP2 and MMP9 (f, g). *p < 0.05, **p < 0.01, ***p < 0.001. Asterisks indicate that difference between two groups is statistically significant. The experimental data were represented by mean±SD