Figures & data
Figure 1. WFA prevented kidney damage and kidney function in PO-induced hyperuricemic mice. (a) Representative H&E images and quantification showing the inhibitory effect of WFA on pathological changes. (b) Representative Masson trichrome staining images and quantification showing the impact of WFA on pathological changes. The levels of (c) creatinine, and (d) BUN were examined by means of kits. N = 10 in each group. Data were expressed as mean ± standard deviation. *P < 0.05, **P < 0.01 and ***P < 0.001. WFA, Withaferin A; PO, potassium oxonate; ALP, Allopurinol; H&E, Hematoxylin & Eosin; BUN, blood urea nitrogen
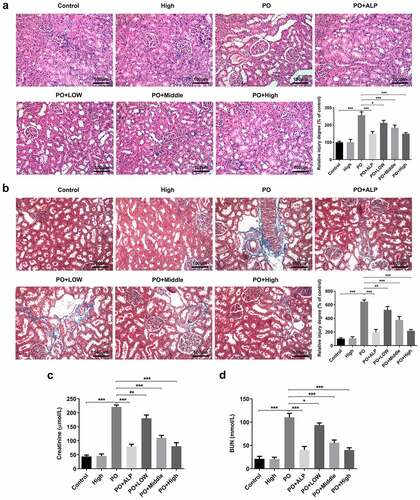
Figure 2. WFA inhibited the fibrosis of kidney tissues in PO mouse model. (a) The expression of α-SMA was determined using immunofluorescence assay. (b) The expression of FN, collagen1 and a-SMA was determined using western blotting. N = 10 in each group. Data were expressed as mean ± standard deviation. *P < 0.05, **P < 0.01 and ***P < 0.001. WFA, Withaferin A; PO, potassium oxonate; α-SMA, α-smooth muscle actin; FN, fibronectin
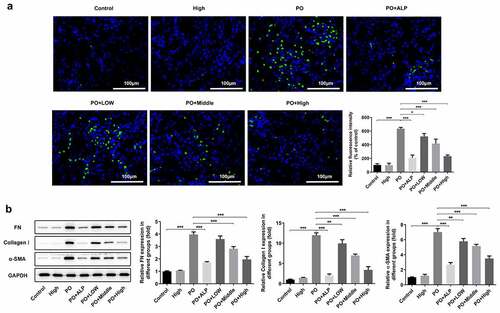
Figure 3. WFA suppressed cell apoptosis of kidney tissues in PO mouse model. (a) Cell apoptosis was examined using TUNEL staining. (b) The levels of apoptosis-related proteins including Bcl-2, Bax, cleaved caspase-3 and cleaved caspase-9 was tested by western blotting. N = 10 in each group. Data were expressed as mean ± standard deviation. *P < 0.05, **P < 0.01 and ***P < 0.001. WFA, Withaferin A; PO, potassium oxonate; ALP, Allopurinol; TUNEL, Terminal-deoxynucleoitidyl Transferase Mediated Nick End Labeling
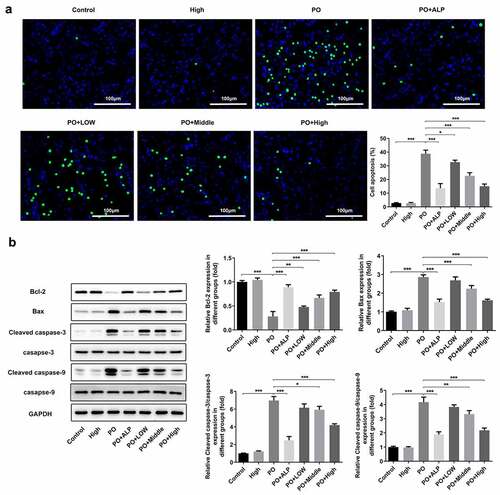
Figure 4. WFA reversed the changed expression of transportation protein in kidney tissues of PO mouse model. The content of (a) UA and the activity of (b) XOD were measured using kits. (c and d) Western blot analysis was employed to evaluate the level of transportation protein. N = 10 in each group. Data were expressed as mean ± standard deviation. *P < 0.05, **P < 0.01 and ***P < 0.001. WFA, Withaferin A; PO, potassium oxonate; ALP, Allopurinol; UA, uric acid; XOD, xanthine oxidase; OAT, organic anion transporter; ABCG2, ATP-binding cassette subfamily G member 2; URAT1, urate reabsorptive transporters urate transporter 1; GLUT9, and glucose transporter 9
Figure 5. WFA prevented UA-induced fibrosis in NRK-52E cells. (a) Cell viability was assessed with a CCK-8 assay. (b) The level of α-SMA was determined using immunofluorescence assay. (c) Western blotting was employed to assess the expression of FN, collagen1 and a-SMA. Data were presented as the mean ± standard deviation of three independent experiments. **P < 0.01 and ***P < 0.001. WFA, Withaferin A; UA, uric acid; α-SMA, α-smooth muscle actin; FN, fibronectin
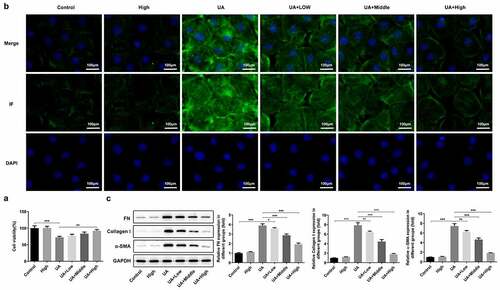
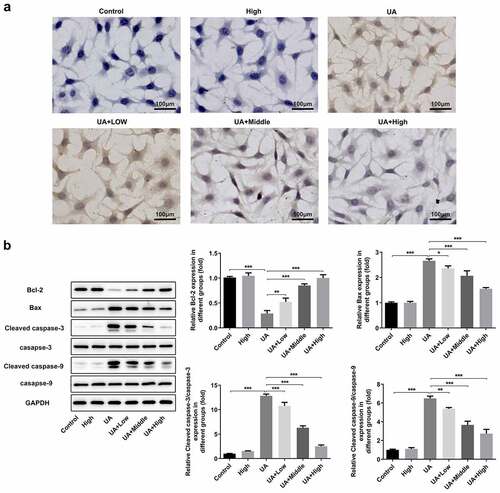
Figure 6. WFA blocks UA-induced apoptosis in NRK-52E cells. (a) Apoptosis of NRK-52E cells induced by UA was evaluated using TUNEL staining. (b) The levels of apoptosis-associated proteins was tested with western blot analysis. Data were presented as the mean ± standard deviation of three independent experiments. *P < 0.05, **P < 0.01 and ***P < 0.001. Withaferin A; UA, uric acid; TUNEL, Terminal-deoxynucleoitidyl Transferase Mediated Nick End Labeling.Highlights.