Figures & data
Figure 1. Inhibitory effect of PTF from young loquat fruits on PPO
Figure 2. Consecutive spectra obtained during the oxidation of L-DOPA by PPO. (a), Consecutive spectra in the absence of PTF. (b). Consecutive spectra in the presence of PTF. Lines 1–10 represent 0–9 min after the addition of the enzyme. PTF: 20 μg/mL
Figure 3. Inhibition mechanism of PTF from young loquat fruits on PPO. The concentrations of PTF for lines 1–5 were 0, 5, 10, 15, and 20 μg/mL
Figure 4. Inhibition type and inhibition constants of TF from young loquat fruits on PPO. The concentrations of TF for lines 1–5 were 0, 5, 10, 15, and 20 μg/mL
Figure 5. Effect of PTF from young loquat fruits on the emission spectrum of PPO. (a), Intrinsic fluorescence changes. (b), Florescence intensity changes. (c), Stern–Volmer curves of PTF. (d), Plot of log[(F0 − F)/F] against log[I] for PTF
![Figure 5. Effect of PTF from young loquat fruits on the emission spectrum of PPO. (a), Intrinsic fluorescence changes. (b), Florescence intensity changes. (c), Stern–Volmer curves of PTF. (d), Plot of log[(F0 − F)/F] against log[I] for PTF](/cms/asset/fc5a35ec-bf88-4961-8df5-e72b282ed863/kbie_a_1886387_f0005_oc.jpg)
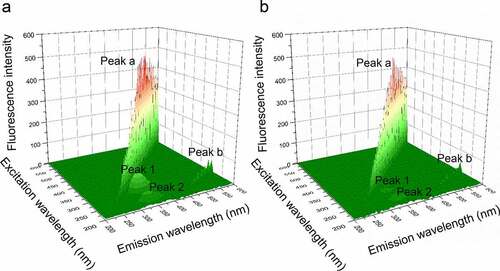
Figure 6. (a), Three-dimensional fluorescence spectra of PPO in the absence of PTF; (b), Three-dimensional fluorescence spectra of PPO in the presence of PTF (20 μg/mL)