
Figures & data
Table 1. Details of TCGA and GEO data included in this analysis
Table 2. Characteristics of TCGA gastric cancer patients
Figure 1. The methylation level of CDKN2A gene grew in GC tissues when viewed in contrast with normal gastric tissues. (a) TCGA datasets. (b) GSE30601 datasets
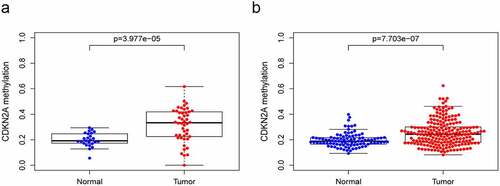
Figure 2. Correlation of CDKN2A gene methylation and expression on TCGA data. (a) CDKN2A gene methylation with CDKN2A expression. (b) cg00718440 methylation with CDKN2A expression. (c) cg03079681 methylation with CDKN2A expression. (d) cg04026675 methylation with CDKN2A expression. (e) cg07562918 methylation with CDKN2A expression. (f) cg10848754 methylation with CDKN2A expression. (g) cg14069088 methylation with CDKN2A expression. (h) cg14430974 methylation with CDKN2A expression. (i) cg12840719 methylation with CDKN2A expression
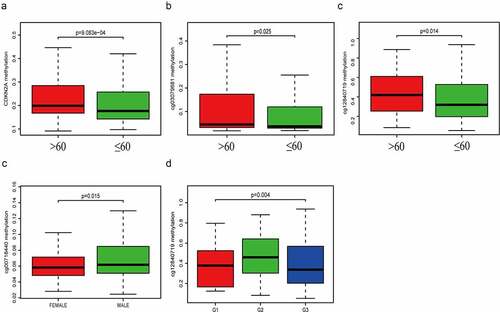
Figure 3. The relationship linking CDKN2A gene and each locus methylation with clinicopathologic parameters. (a) CDKN2A gene methylation with age. (b) cg03079681 methylation with age. (c) cg12840719 methylation with age. (d) cg00718440 methylation with gender. (e) cg12840719 methylation with tumor grade
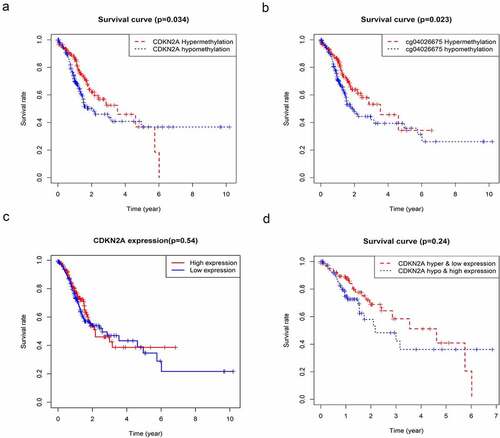
Figure 4. The association between CDKN2A gene methylation and expression with OS based on TCGA data. (a) Correlation of CDKN2A gene methylation with OS. (b) Correlation of cg04026675 methylation with OS. (c) Correlation of CDKN2A expression with OS. (d) Correlation of CDKN2A gene high methylation and low expression with OS. Hyper & low expression, hypermethylation, and low expression; hypo & high expression, hypomethylation, and high expression. OS
Table 3. Univariate prognostic analysis for OS
Figure 5. OS rate by prespecified patient subgroups defined by baseline characteristics. (a) CDKN2A gene methylation and other clinicopathologic variables; (b) cg03079681 methylation and other clinicopathologic variables. (c) cg04026675 methylation and other clinicopathologic variables. (d) cg07562918 methylation and other clinicopathologic variables. (e) cg13601799 methylation and other clinicopathologic variables
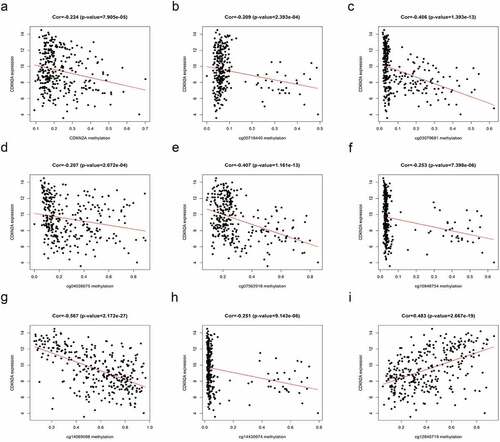
Table 4. Enriched hallmark gene sets for CDKN2A gene methylation phenotype in GC
Figure 6. Panel with 3 gene sets enriched for CDKN2A gene hypermethylation and 10 gene sets enriched for CDKN2A gene hypomethylation in GC
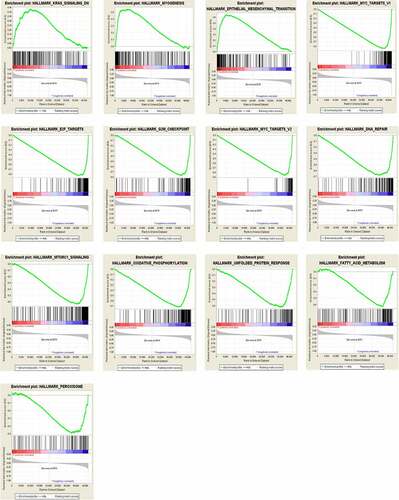
Figure 7. Immunohistochemistry and CDKN2A methylation-specific PCR in GC and adjacent non-tumor tissues. (a) Representative examples of IHC staining for CDKN2A protein expression (Magnification, 400×). (b) Representative examples of methylation analysis of CDKN2A gene promoter. U, unmethylation; M, methylation; T, primary gastric carcinoma tissues; NT, adjacent non-tumor tissues
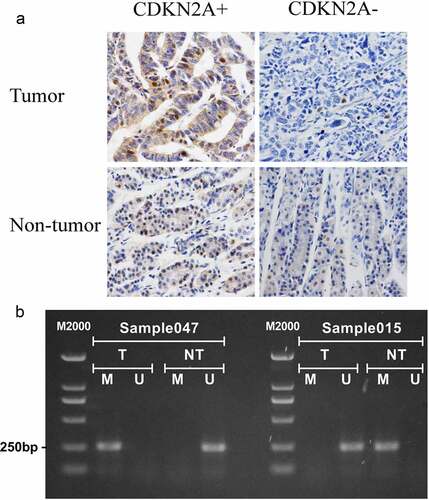
Table 5. CDKN2A gene methylation and expression in 62 gastric cancer tissues and 62 non-tumor tissues
Table 6. The association between methylation and gene expression in 62 tumor tissues