
Figures & data
Table 1. The correlations between miRNA-mRNA/lncRNA-mRNA pairs identified by starBase database
Figure 1. Identification of DE-mRNAs in two GEO datasets
(a-b) The volcano plots of DE-mRNAs in GSE29570 and GSE63514 datasets. The horizontal axis indicates −10(adj P. Val), and the vertical axis indicates log FC. All of the DE-mRNAs were shown on the two volcano plots: the gray dots represent genes with no differentially expression, and the blue dots and red dots respectively represent the downregulated and upregulated genes. (c-d) The intersection of upregulated and downregulated DE-mRNAs of two datasets
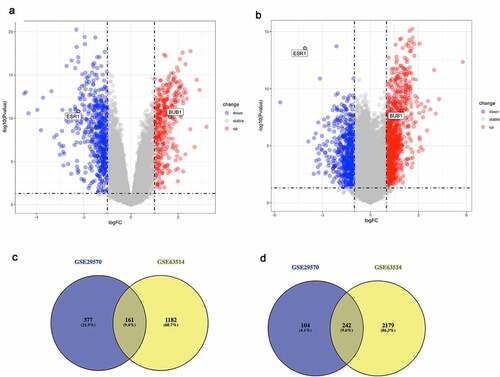
Figure 2. Functional analysis for the DE-mRNAs and identification of hub genes in protein-protein network
(a-b) Enriched BP process of the upregulated and downregulated significant DE-mRNAs. (c-d) Enriched KEGG pathways of the upregulated and downregulated significant DE-mRNAs. (e-f) The top 20 hub genes of the significantly upregulated genes and downregulated genes respectively
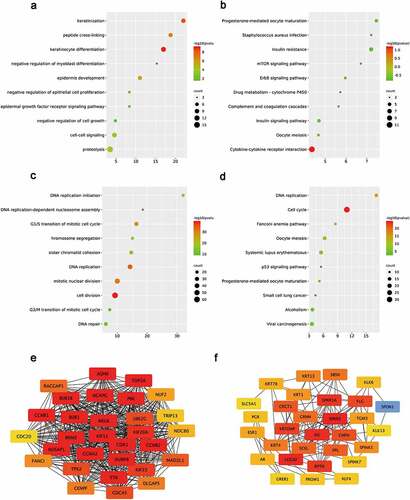
Figure 3. Screening the biomarkers in cervical cancer
(a-b) Identification of biomarkers among the predicted mRNAs by combining expression and prognosis analyses using GEPIA and Kaplan Meier-plotter databases, respectively. (c-j) The representative expression and prognostic value of biomarkers validated in GEPIA and Kaplan Meier-plotter databases
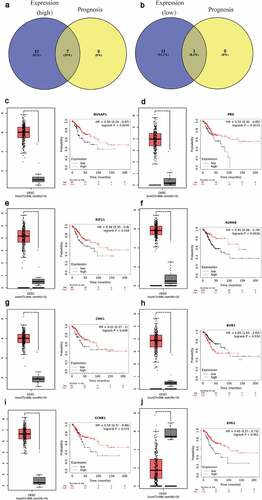
Figure 4. Screening the key lncRNA in cervical cancer
(a-b) Identification of key lncRNAs among the predicted lncRNAs by combining expression and prognosis analyses using GEPIA and Kaplan Meier-plotter databases, respectively. (c-h) The representative expression and prognostic value of potential lncRNAs validated in GEPIA and Kaplan Meier-plotter databases
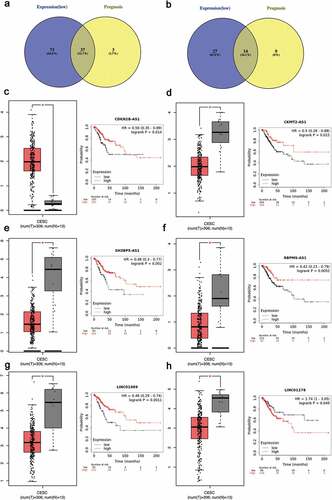
Figure 5. Validation of ce-RNA network
(a) Hela cell was transfected with two CCDC144NL-AS1 siRNAs. qRT-PCR was used to detect the transfection efficiency. (b-d) qRT-PCR was used to detect the expression of hsa-miR-18a-5p, hsa-miR-221-3p and hsa-miR-19a-3p (e) The expression of ERS1 was analyzed by Western blotting (f) CCK-8 assays were conducted to examine Hela cell viability after the knockdown of CCDC144NL-AS1 (g) Edu assays were used to examine cell proliferation (red signal). The cell nuclei were counterstained with Hoechst (blue signal). Representative images are shown
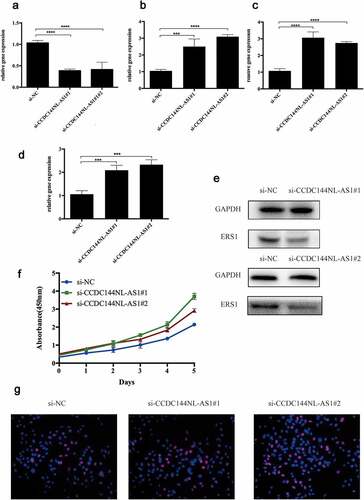
Figure 6. The Cox regression analysis for evaluating the independent prognostic value of the risk score
(a) The potential mRNA-miRNA-lncRNA regulatory network related to cervical cancer prognosis. The red diamond in the network represented ERS1. The green round in the network represented miRNA. The blue one in the network represented lncRNA. (b-c) The univariate and multivariate Cox regression analysis of risk score, age, grade and T stage. (c) Calculate the AUC for risk score, age, grade, and T stage of the total survival risk score according to the ROC curve
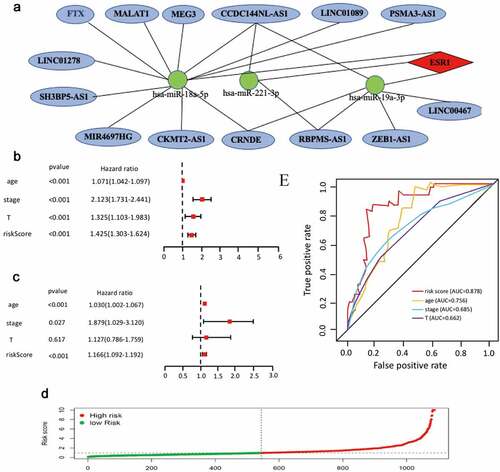
Table 2. The expression levels of these eight RNAs
Supplemental material