Figures & data
Table 1. Clinical information of the 206 NSCLC patients
Figure 1. Overview of the mutation status of the 206 patients with NSCLC based on next-generation sequencing. (a) Coverage depth for gene regions. Distribution of gene mutation types (b) and single mutation types (c) in the 206 patients with NSCLC. (d) Schematic showing 30 genes with the highest mutation frequency
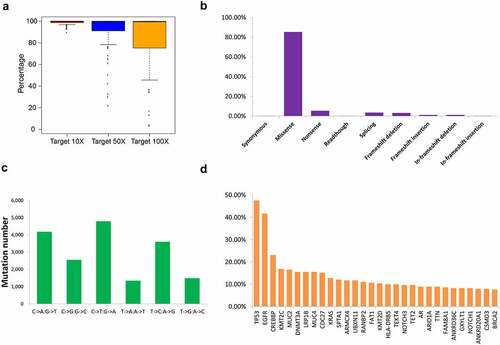
Table 2. Mutation information of the 206 NSCLC patients
Figure 2. TMB analysis of 206 patients with NSCLC. (a) Differences in TMB by sex. (b) Differences in TMB by tumor type. (c) Correlation between TMB and age. TMB, tumor mutation burden
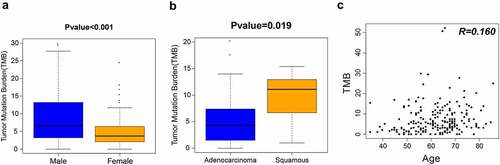
Figure 3. The top 10 high-frequency mutation genes of 206 patients were visualized by OncoPrinter. Each gray box from left to right represents the mutation of a sample
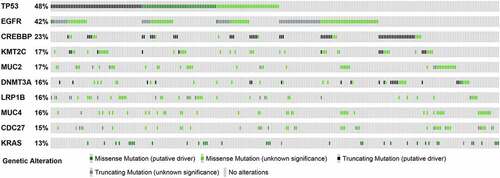
Figure 4. Diagram showing mutant sites and frequency of the top 10 genes harboring high-frequency mutations
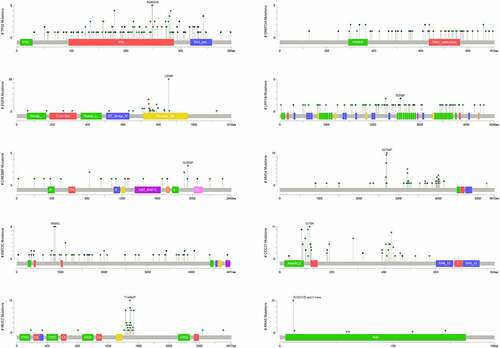
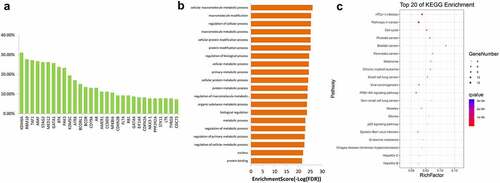
Figure 5. GO (a) and KEGG (b) enrichment analyses for genes with mutation frequency of >5%. GO, Gene Ontology, KEGG, Kyoto Encyclopedia of Genes and Genomes
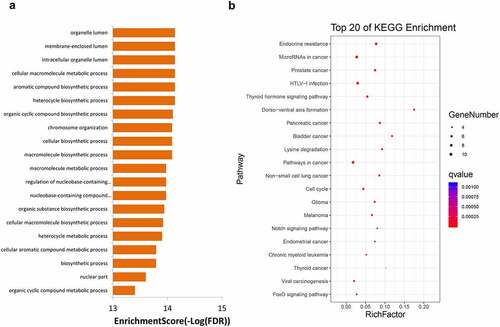
Figure 6. Of enrichment analysis of the 30 genes (a) and their GO (b) and KEGG enrichment analysis results (c) with the highest copy number increase in 206 samples. GO, Gene Ontology, KEGG, Kyoto Encyclopedia of Genes and Genomes
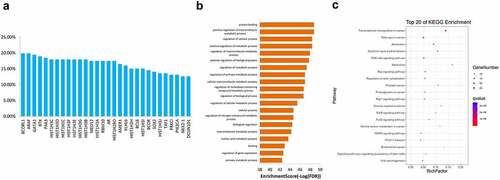
Figure 7. The top 30 genes with the highest copy number deletion in 206 samples (a) and their GO (b) and KEGG (c) enrichment analysis results. GO, Gene Ontology, KEGG, Kyoto Encyclopedia of Genes and Genomes